
How-to: Data-Driven Capacity Planning with MongoDB on OTC Infrastructure
Ideally, an IT application grows its user base over time and in consequence the underlying data infrastructure needs to scale with the increasing workload demands.
We show a data-driven approach to efficient capacity planning for a self-hosted MongoDB-backed IT application that takes both costs and performance into account.
This approach leads to an efficient data infrastructure - both from a technical and a business perspective.
Table of Contents
- Chapter 1: Key Insights
- Chapter 2: Scenario
- Chapter 3: Performance Results
- Chapter 4: Performance/Cost Decision-Making
- Chapter 5: Conclusion
- Appendix
Key Insights – MongoDB Capacity Planning
- Changing a running system should only be done when it is necessary and all required information are available, i.e. there is a clear understanding of the capabilities of the old and the new system.
- For growing applications often not only the primary KPI “Throughput” is relevant, but also latencies and cost-based metrics.
- In this project, we not only compared 6 different VM types to get some hard data for capacity planning, but also found a lot of potential for increasing the efficiency.
- For the near-term goal with a doubled amount of users (growing from 25,000 to 50,000), a VM was identified which delivers 160% more throughput, for only 48% higher monthly costs.
- Further, we identified a far more efficient VM for the next growth stage with a userbase growing up to 90,000 app users. A 73% increase of the monthly costs yields a 250% performance increase.
- Additionally, both options, have lower read and update latencies which will improve the user experience for the app users even by growing user numbers - a great side outcome of the measurements.
- Other VM options either had worse performance or cost efficiency, or did not match the latency requirements.
- While the number of available VMs is huge, a data-driven capacity planning helps to identify efficient and good fitting data infrastructure options. Moreover, it provides a clear understanding of the capabilities and limits of each setup, which is very important for growing IT applications.
The Capacity Planning Scenario - A MongoDB-based Picture App
In this scenario based on customer project, a European social image app is starting up. Since the last feature update, the number of free and paid users has been growing significantly. Monitoring shows 80+% CPU utilization of the MongoDB instances for peak loads. The reason why and how can not be disclosed here, but also do not matter in the scenario, as it shall not be changed right now.
The self-managed MongoDB instances are running on Open Telekom infrastructure due to EU GDPR compliance and low-latencies issues. The infrastructure provider shall also not be changed, due to implementation and governance reasons.
Originally, the app had around 10,000 users, but as mentioned earlier, this number has been growing significantly after the last hot feature update to 25,000 users and is still growing. Due to the high CPU utilization the CTO is starting to worry about how long this will work.
Objectives
This data-driven capacity planning benchmarking project has 3 goals, which are closely related:
- Performance: For further users and their interactions a more powerful data infrastructure needs to be selected. The goal is to find a infrastructure that can handle the growth from 25,000 users to 50,000 users. But also the latencies should not increase by more than 5% for the 95th percentile to not disturb the user experience.
- Future Planning: Based on the actual workload experience a clear path and milestone for further data infrastructure updates should be clear. This means to know the capabilities of the future setup and rematch it to user numbers.
- Cost/Performance: Many app users only use a free plan at the moment, therefore a cost-efficient data infrastructure is needed. So one of the most important KPIs is the Throughput/Cost ratio.
Options
The offer of different VMs from a Cloud provider is huge. Different VM types, different CPU/memory ratios and storage types are available.
The app runs at the beginning on a memory optimized, older m3-xlarge-8 (4vCPU / 32GB RAM) with high-performance (SSD) storage.
The following infrastructure options of OTC were analyzed and pre-selected. The total number of available VM types is three times larger.
| VM | VM Type | VM Size | Storage Type | Monthly Costs |
|---|---|---|---|---|
| m3-xlarge-8-SAS | memory-optimized | 4 vCPU / 32 GB RAM | High-IO SSD | 797.76 € |
| c4-xlarge-4-SAS | dedicated | 4 vCPU / 16 GB RAM | High-IO SSD | 694.08 € |
| s3-2xlarge-4-SAS | general-purpose | 8 vCPU / 32 GB RAM | High-IO SSD | 1,026.72 € |
| s3-2xlarge-8-SAS | general-purpose | 8 vCPU / 64 GB RAM | High-IO SSD | 1,180.08 € |
| m4-2xlarge-8-SAS | memory-optimized | 8 vCPU / 64 GB RAM | High-IO SSD | 1,625.04 € |
| c4-2xlarge-4-SSD | dedicated | 8 vCPU / 32 GB RAM | Ultra-High-IO SSD | 1,377.12 € |
The available options at AWS, MS Azure, GCP are even larger, but can be mapped to the same approach and solution-finding.
- In batch 1 the current setup (m3-xlarge-8-SAS) was benchmarked as a baseline. Primary goal here is to configure the workload for an 80% CPU utilization. In the same batch, the dedicated VM option (c4-xlarge-4-SAS) with similar resource specification and nearly identical pricing was also tested.
- In batch 2 general purpose VMs with doubled resources, 8 vCPUs instead of 4vCPUS were measured. Their pricing is 30-50% more expensive than the current setup.
- In batch 3 specialized VMs with doubled resources were tested to identify the best option. The monthly costs of these VMs are 72% / 103% higher than the current setup.
The performance measurements were executed in three consecutive runs.
Benchmark
As mentioned in the intro the application is a simple image app with a lot of reads and some update operations by the users. This workload needs either to be recreated from real world query traces or approximately modelled with an existing benchmarking suite.
In this case we can rely on the Yahoo Cloud Serving Benchmark (YCSB) that provides a workload (YCSB B) that is similar to the application workload and could be adjusted through its configuration to map the application workload.
The number of clients were configured to create a load for 80% CPU consumption for the baseline configuration.
The exact workload specification can be found in the appendix.
Performance Results - MongoDB Capacity Planning
While the project was done in 3 consecutive batches, we present the results of all batches in aggregated diagrams for better readability.
One of the project objectives is to find a setup which can handle more operations per second, which means more users can interact with the application at the same time. Another objective was to have a similar latency for stable user experience.
Let’s analyze the results regarding these 3 objectives.
Throughput

- The measurement of the m3-xlarge-8-SAS delivers the baseline performance. The 25,000 app users create around 80% CPU consumption, which maps to around 6k-7k operations per second.
- The results for the first alternative, c4-xlarge-4-SAS, a dedicated VM, are below the actual baseline. So it is not a suitable option.
- In batch 2, general purpose VMs with doubled vCPUs were measured. The s3-2xlarge-4-SAS (8 vCPUs/ 32GB RAM) only delivered around 5% more throughput, the s3-2xlarge-8-SAS (8 vCPU / 64GB RAM) delivers 2.5x higher throughput.
- In batch 3 the VMs with the more expensive optimized resources are showing great performance with 148% higher throughput for the memory-optimized m4 and 256% higher throughput for the dedicated c4-2xlarge with ultra-high-IO.
- While the baseline VM can handle around 25,000 app users, the strongest c4-2xlarge is able handle around 80,000-90,000 app users for the same workload without being stressed.
- For the targeted 50,000 users the s3-2xlarge-8 and the m4-2xlarge-8 also deliver sufficient throughput (~60,000-65,000 users).
Read Latency
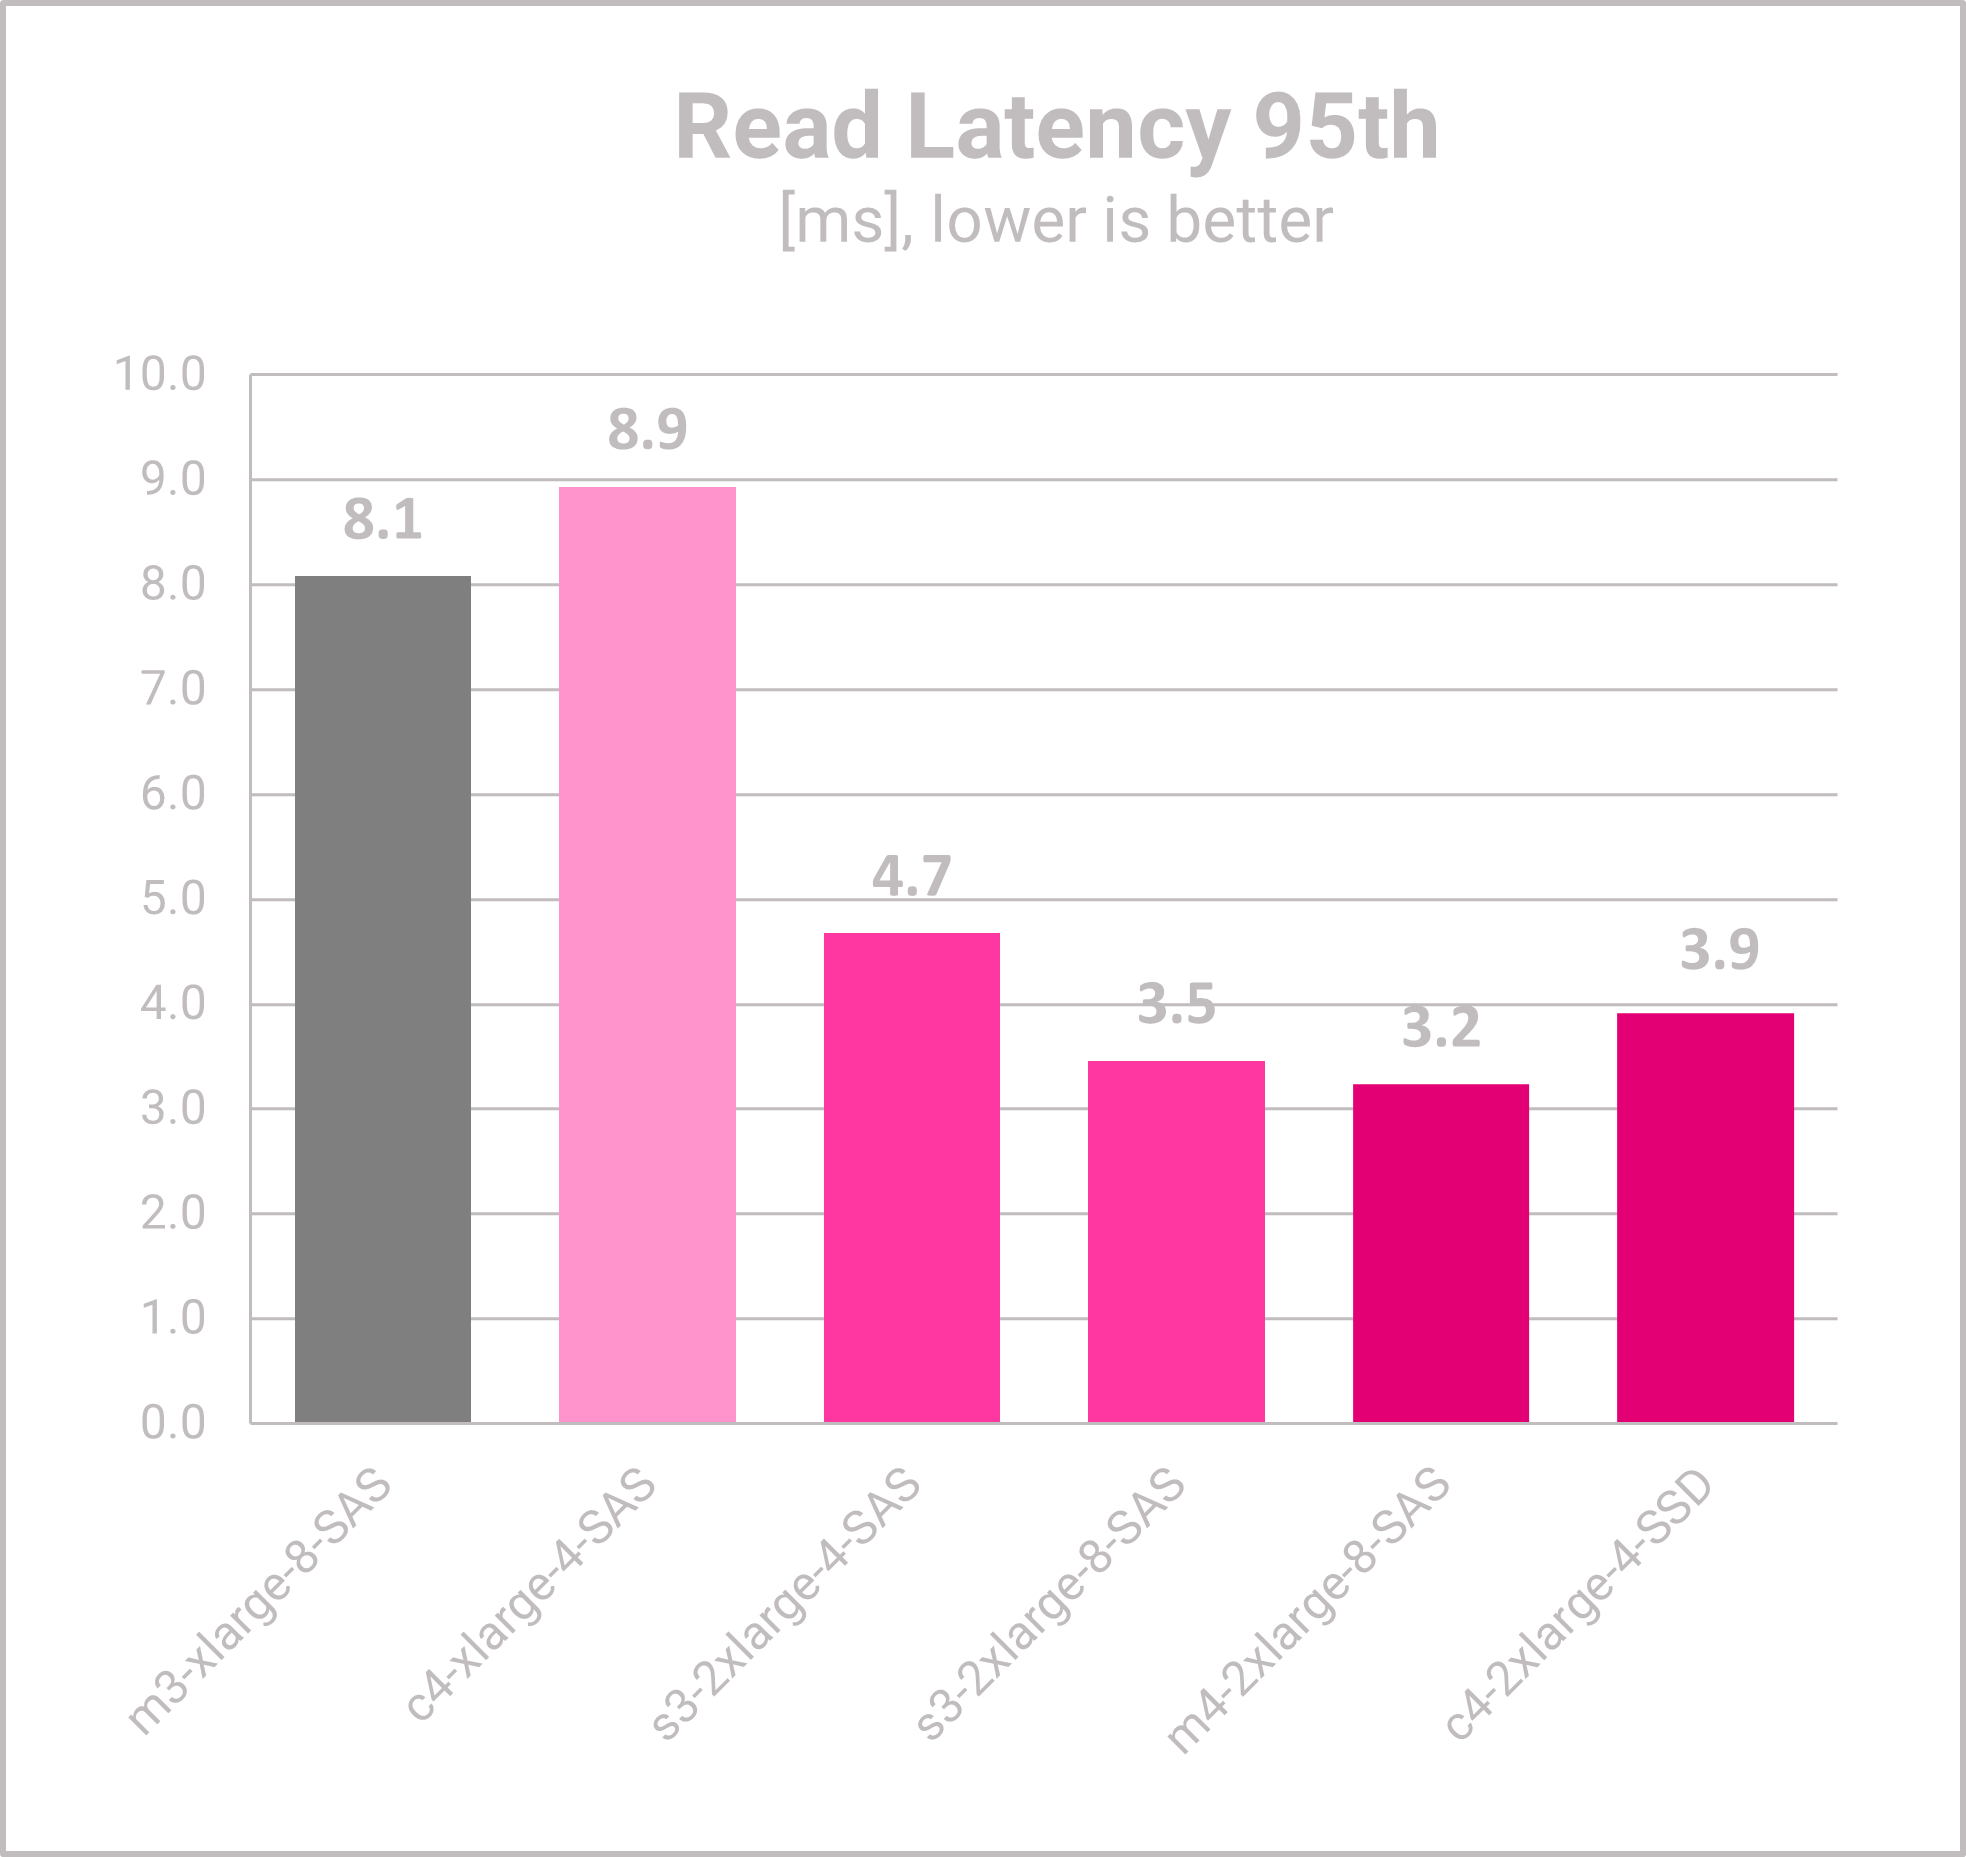
- The read latency of m3-xlarge (baseline ) and the dedicated c4-xlarge are the highest measured read latencies.
- The larger VMs from batch #2 and #3 have significantly lower latencies, which is great for the user experience of the app users.
Update Latency
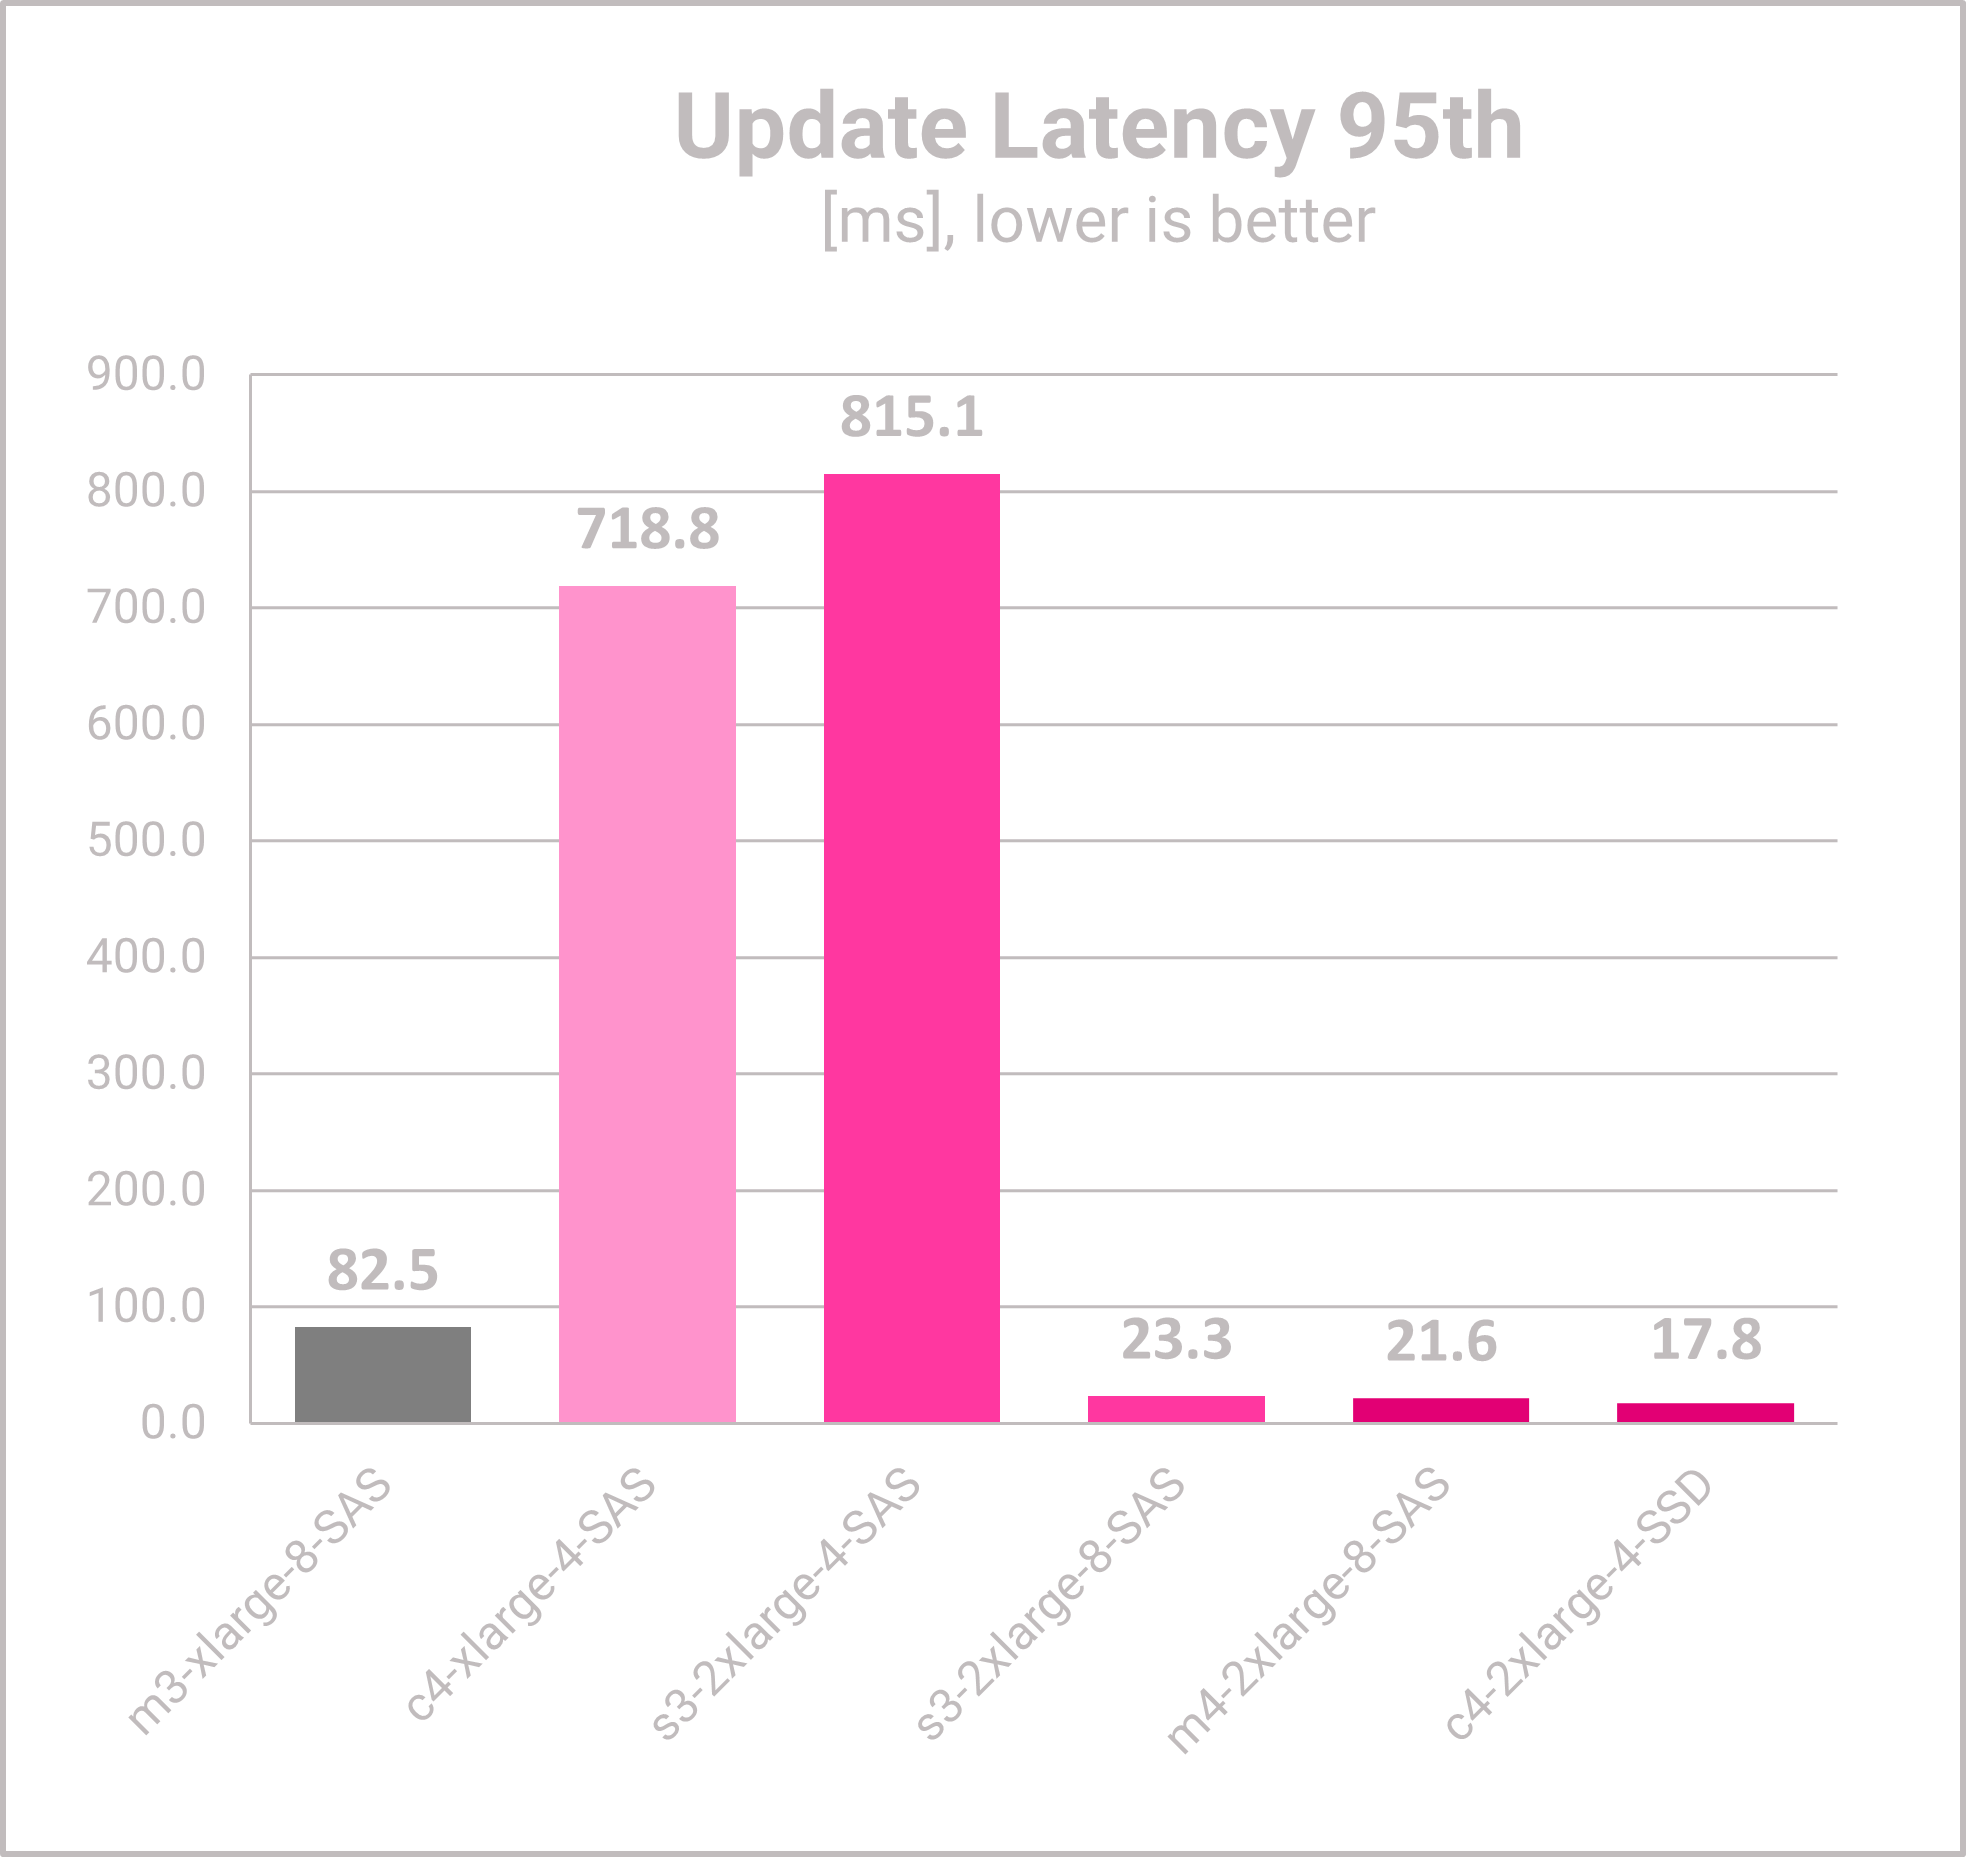
- The update latencies for c4-xlarge and s3-2xlarge-4, are significantly worse than the baseline and the higher priced VM options.
- Even if the update latency is mostly not that important for the users, the two VMs with the high update latency cannot be recommended in this scenario.
- The three larger VMs have significantly lower update latencies and are a valid option.
Performance/Cost Analysis – MongoDB Capacity Planning
After measuring 6 VMs for the MongoDB configuration and the modelled YCSB B workload, 3 potential candidates were identified. All of them can handle the future user base. Yet, at the end, not only performance but also costs are important for this technical business decision.

- The costs for the baseline VM is around 800 € per month. The dedicated c4-xlarge is 100 € more expensive..
- The standard s3 instances with doubled vCPUs are priced between 1,026 € and 1,180 € per month.
- The specialized resources m4-2xlarge and c4-2xlarge are nearly twice as expensive as the baseline VM.
- Which VM has the best price/performance efficiency?
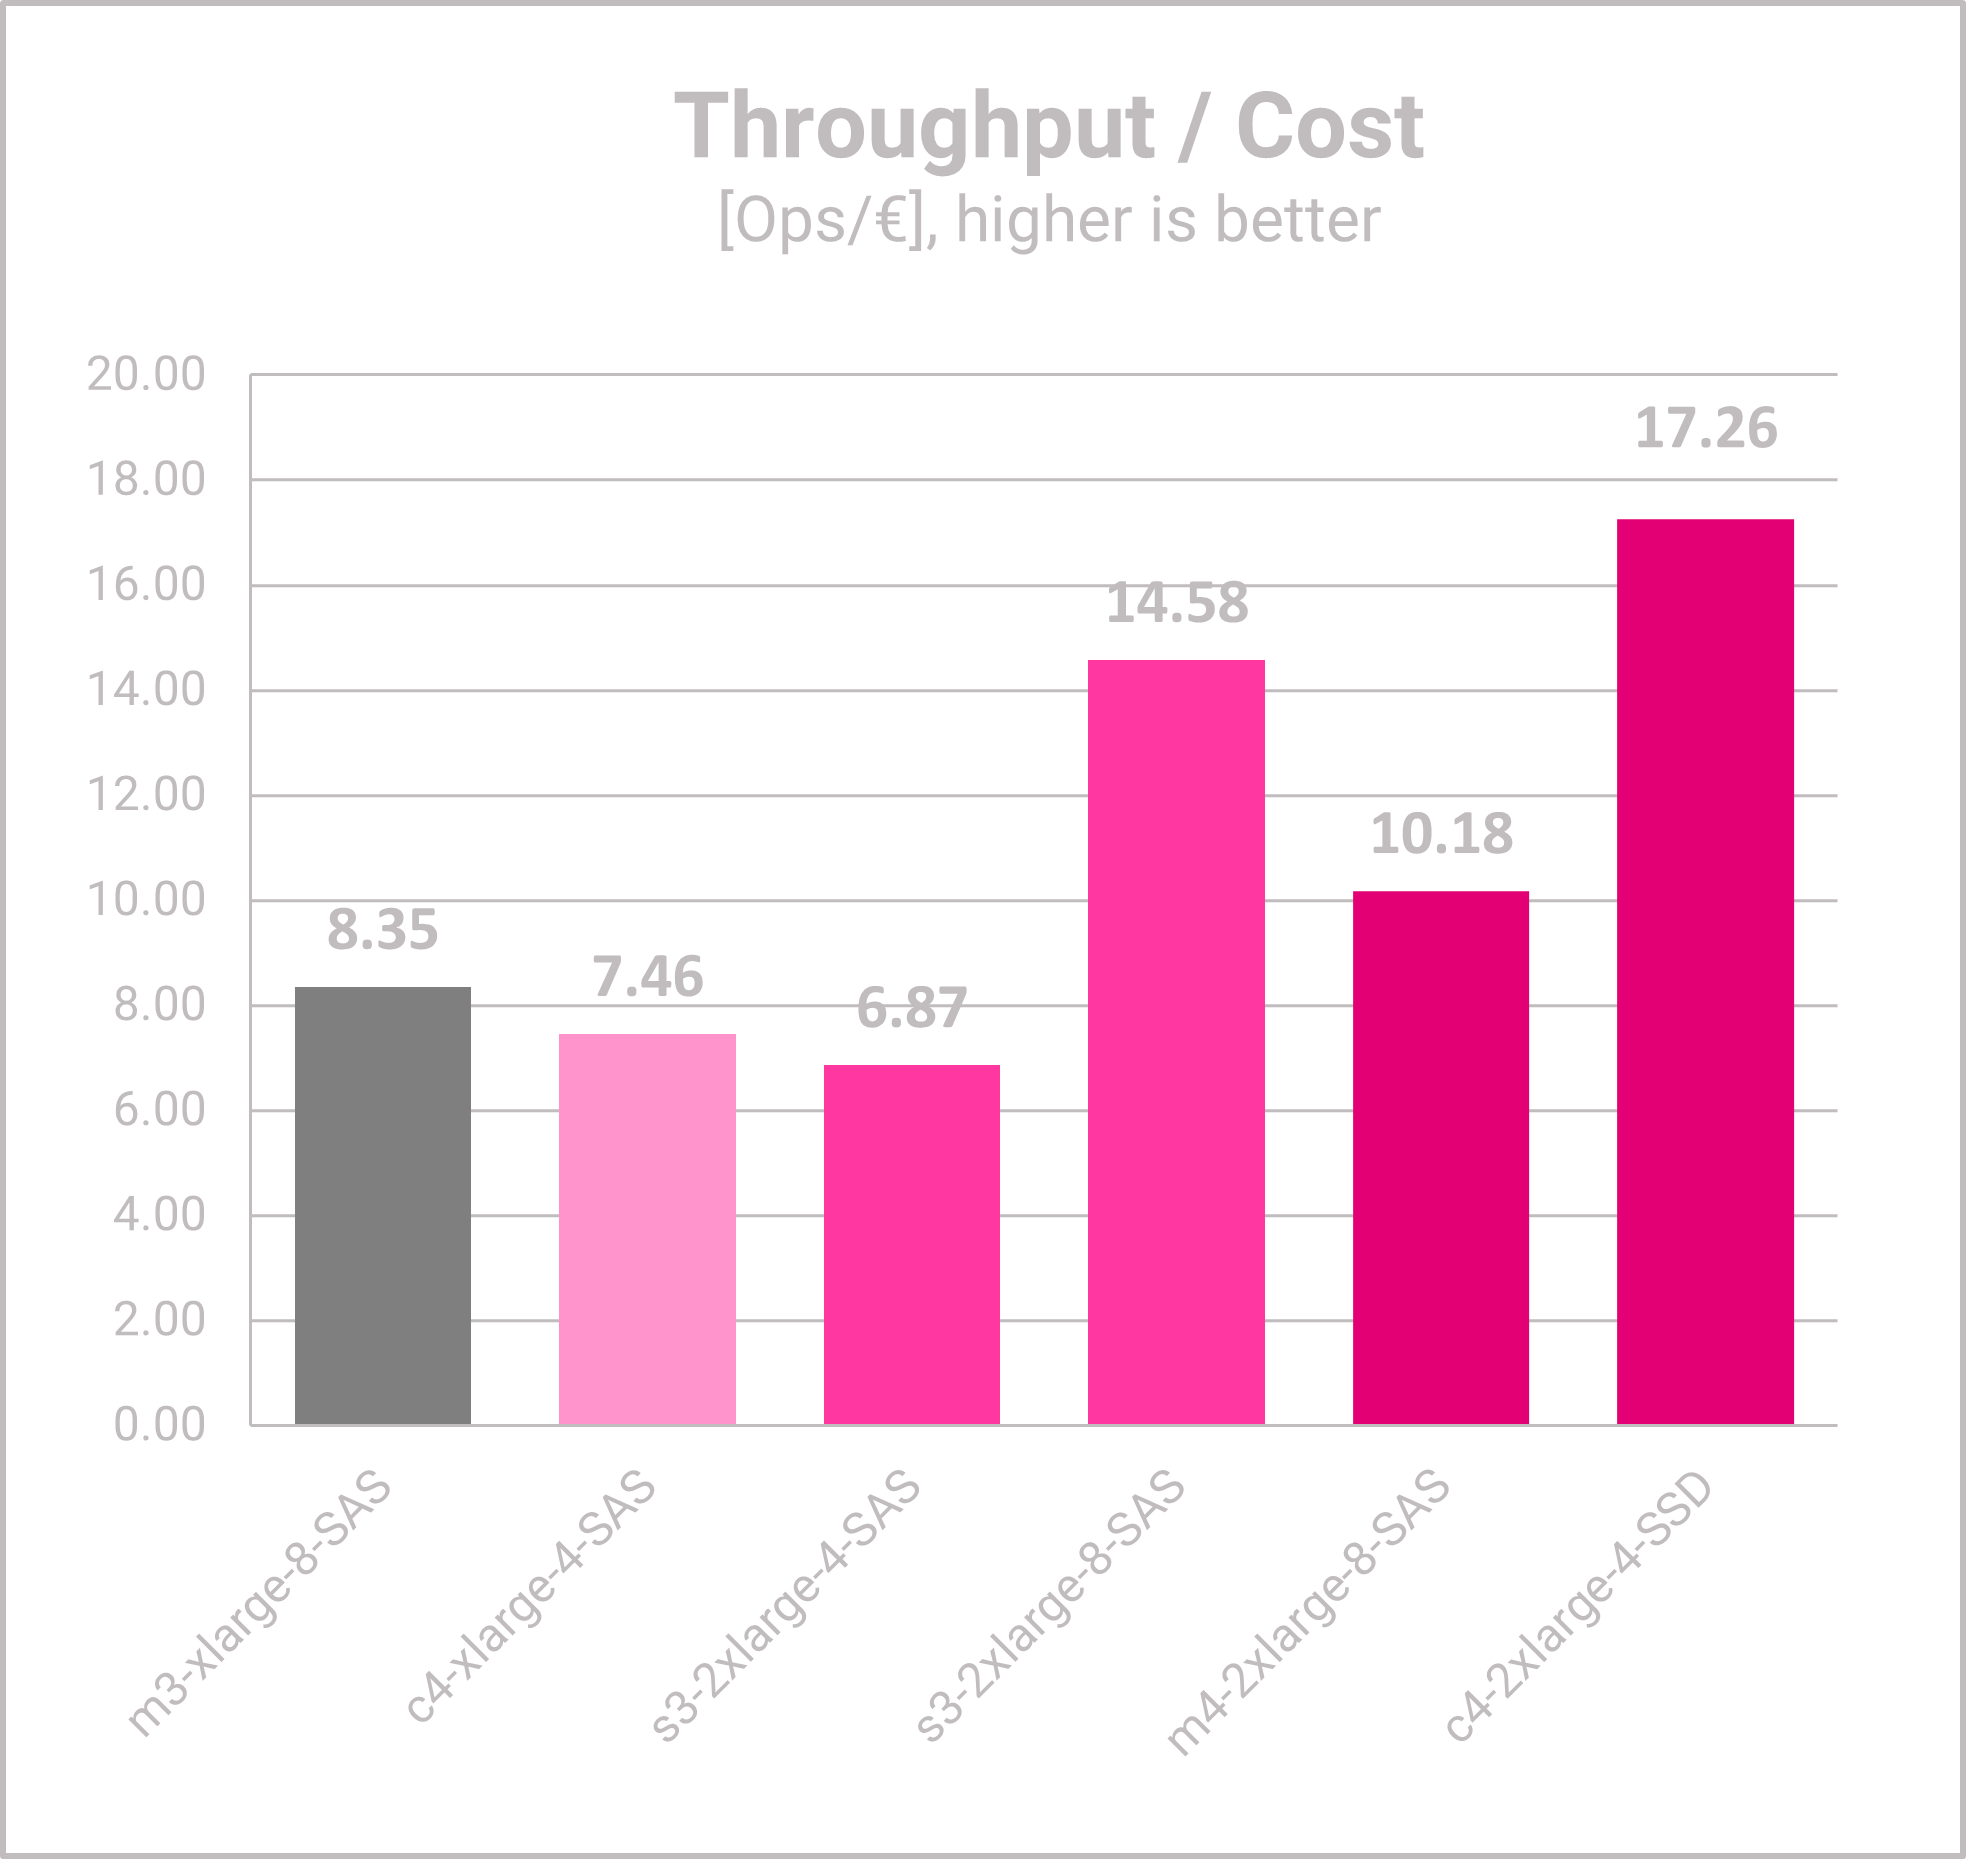
- The baseline VM has a solid throughput/cost ratio of 8.
- The c4-xlarge and s3-2xlarge, have not only bad latencies, but also a worse price/performance ratio than the baseline.
- The s3.2xlarge-8 has a great throughput/cost ratio, which is 75% better than the baseline. Also, this VM can handle the targeted 50,000 app users easily.
- Amongst the specialized, high-priced options from batch 3, the c4-xlarge has the best price/performance ratio which is twice as good as the baseline and even 20% better than the s3-2xlarge-8.
Conclusion
This project shows the great power of database benchmarking for capacity planning. A few options have been measured, some beat the objectives, some do not. At the end, two potential VMs were identified – one for the growth stage up to 50,000 users and one for the next stage up to 90,000 users. Compared to the baseline (current set-up), both options have lower latencies and a far better price/performance ratio. This means that the cost per user for the infrastructure will decrease.
Of course, not all available VM and storage options have been measured. But even with this small set, a lot of helpful data for decision-making and improving the data infrastructure is now available.
Appendix - Benchmarking Specification
| Database Configuration | Value |
|---|---|
| Database | MongoDB |
| Version | 7.0.2 |
| Cluster Type | Replica Set |
| Nodes | 3 |
| Configuration | Default |
Appendix – Workload & Database Specification
| Benchmark Configuration | Value |
|---|---|
| Benchmark Suite | YCSB |
| Version | 0.18.0-SNAPSHOT |
| Runtime [m] | 30 |
| Threads | 75 |
| Data [GB] | 50 |
| Read Requests [%] | 95 |
| Update Requests [50%] | 5 |
| Request Distribution | zipfian |