
Who’s Leading in Database Performance? Find Out in Our Updated Ranking ⚡
The benchANT Database Performance Ranking has been evolving behind the scenes: new databases and fresh benchmark results have quietly made their way into the ranking. Now, we are pulling back the curtain and sharing how the ranking can help you make smarter decisions about performance, scalability, and cost-efficiency. In this article, we walk through six practical use cases showing how to use the ranking to compare databases, clouds, and configurations and why independent benchmarking matters more than ever.
We will continue expanding the coverage of the ranking and want your input on which database should be included next. Let us know using our contact form or vote in our current LinkedIn poll.
1,000+ Databases to Choose From
In 2022, when we launched benchANT, there were over 380 popular SQL and NoSQL systems ranked on db-engines and more than 800 entries listed in the Database of Databases (DBDB). Today, in June 2025, db-engines tracks 420+ products, while the total number of databases listed in the DBDB exceeds 1,030. In addition, there are thousands of cloud infrastructure resources that can be used to host these databases. The question is: how do you choose from such a rapidly growing variety?
The knowledge hubs mentioned above are extremely valuable, but they serve different purposes: db-engines focuses on database popularity, while DBDB provides generic, high-level information. That’s why we introduced a publicly available database ranking — designed to enable open and independent evaluation of key performance parameters across multiple cloud infrastructures. To maximize its value for database engineers, SREs, DevOps teams, and architects, we built the ranking on technical performance metrics as its foundation.
The foundations of our benchmarking framework were established by Dr. Daniel Seybold, CTO at benchANT, and Dr. Jörg Domaschka, CEO at benchANT. Rooted in PhD-level research, the framework follows a scientific and transparent approach, providing formalized, independent performance analyses.
Since then, we have maintained and continuously refined the benchmark for three distinct database workloads (listed below). The framework has been presented at several tech conferences, including Percona Live, Scylla Summit, and data2day.
As of now, we track 178 combinations of 16 database offerings (SQL, NoSQL, and NewSQL) across different product versions, four cloud providers, and up to five scaling configurations. Although only a few new databases were added between 2023 and 2024, our goal for 2025 is to extend the ranking with additional systems and deliver a complete UX redesign. We also plan to introduce dedicated rankings for popular DBaaS offerings, including PostgreSQL, MySQL, MongoDB, and Cassandra.
So how can you make use of these open benchmarking insights when comparing competing database management systems (DBMS)? In this article, we’ve collected six practical use cases to help you choose the right database for your specific scenario.
Ranking Workloads
The benchANT database performance ranking currently contains measurement for the following three workloads:
- CRUD: General-Purpose, a 50% READ / 50% WRITE workload based on the Yahoo Cloud Serving Benchmark (YCSB)
- OLTP: Mix, a transactional scenario, nontrivial operations, 100 tables, based on Sysbench performance benchmark
- Time-Series: DevOps emulating data from 9 virtual endpoints, such as CPU, memory, disk, etc., based on the Time Series Benchmark Suite (TSBS)
In the following use cases, we will focus on the “CRUD: General-Purpose” workload. A pattern similar to this one can be found in CRM/ERP systems, mobile apps, and so on. It is worth noting that no transactional operations are performed, only simple READs—e.g., via a primary key or based on a condition. JOINs, ORDERs, or GROUP BY commands are not performed in this workload.
UC1: Compare the Performance of Different Database Systems
You can use open benchmarking data to compare key performance parameters across competing database products. For example, for the CRUD workload, you can evaluate metrics such as read and write latencies as well as throughput.
Here’s a snapshot of the current top five leaders for the CRUD workload (as of October 2025).
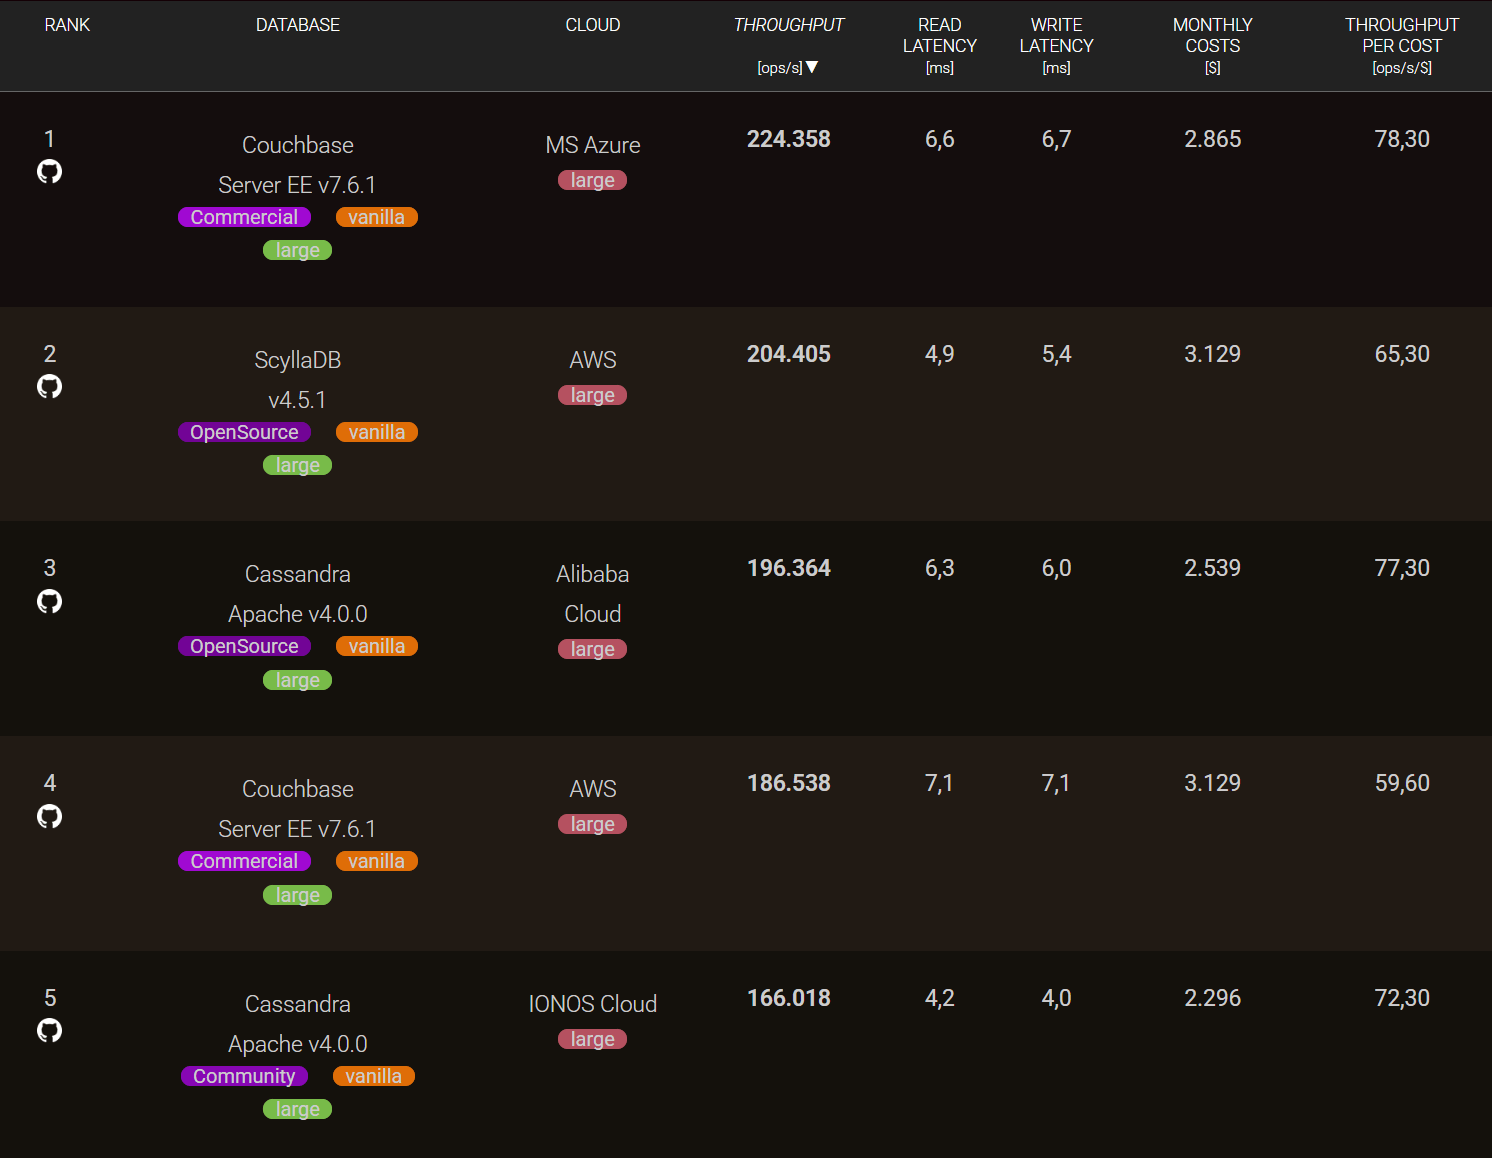
It is important to note that a database with higher throughput may not necessarily be the leader in terms of latency, and vice versa. Whether you are an SRE, a DevOps engineer, or a data engineer, your priorities will differ — and these priorities directly influence your selection process.
If you are building a logging or data storage system, you might prioritize write latency. For a highly available system or caching layer, read latency may be more critical. In high-load systems or intensive data pipelines (such as large-scale ETL or real-time IoT systems with thousands of bidirectional devices), throughput and scalability become key. Whatever your scenario, if you’re developing a highly interactive application, you’ll likely need to balance both throughput and latency to achieve optimal performance.
UC2: Compare the Price–Performance of Different Database Systems
Generally, while higher costs often correlate with higher throughput, the economic efficiency of that performance can vary significantly between databases. With our open ranking, you can evaluate to what extent this relationship holds true.
This efficiency can be expressed as:
Price–Performance Ratio = Throughput / Cost
Where:
- Throughput refers to the maximum number of operations the database performs per second (ops/sec).
- Cost is the monthly expense for compute and storage resources required to achieve that throughput, measured in U.S. dollars (excluding networking, backup, licensing, or discounts).
- The Price–Performance Ratio (PPR) is measured in operations per second per dollar (ops/sec/$).
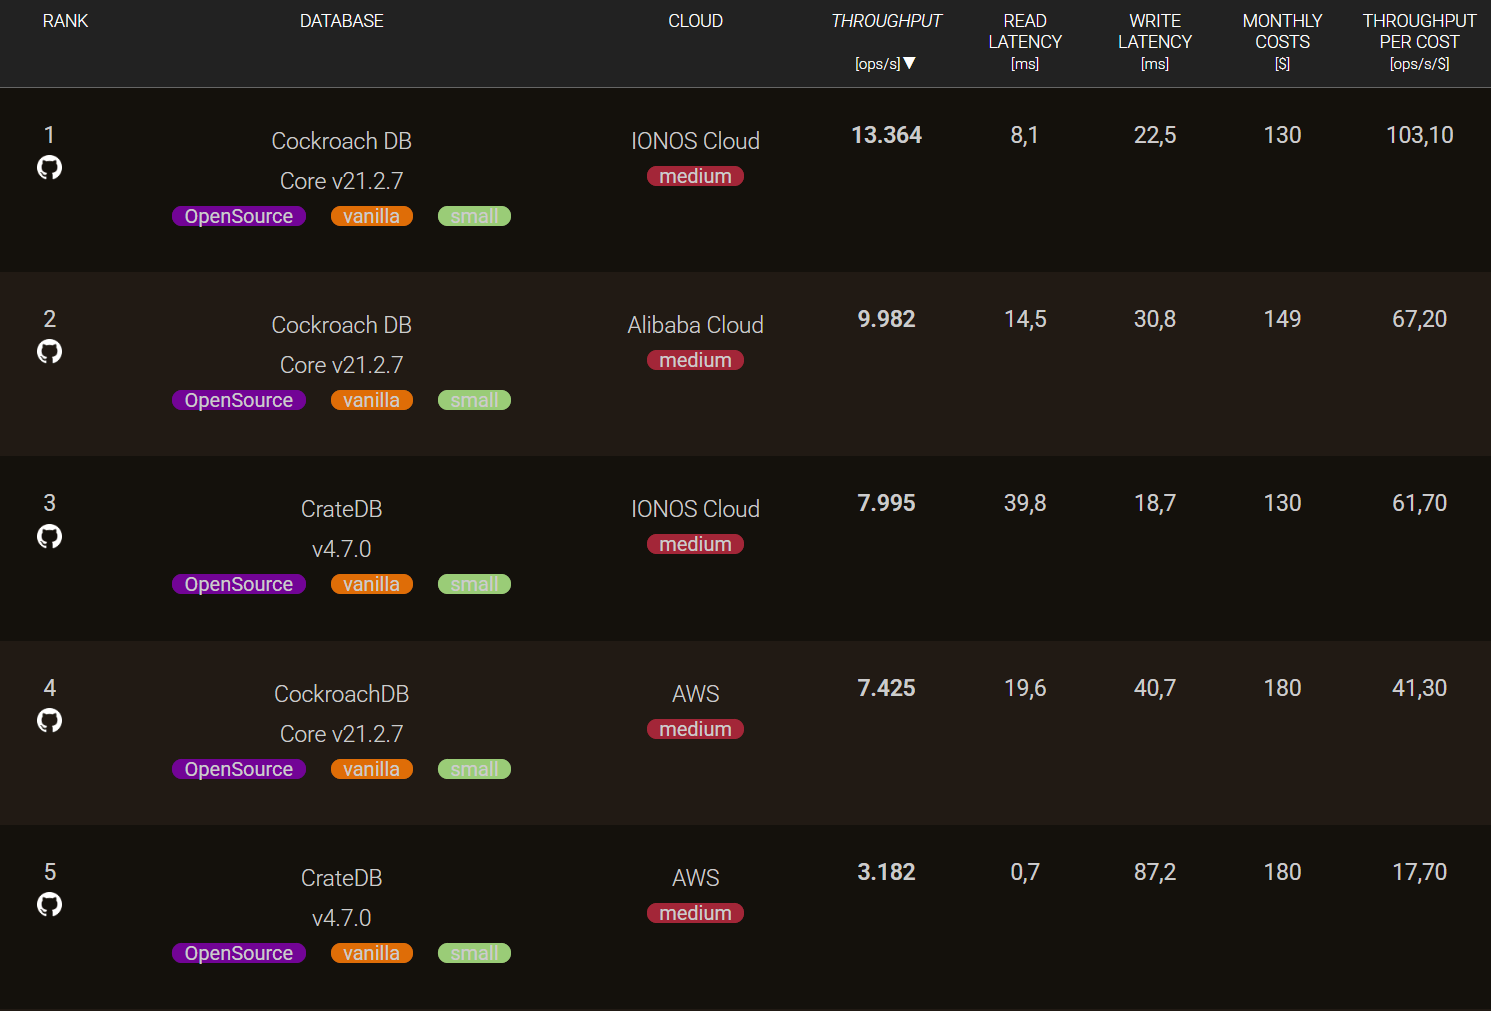
Price–performance insights are particularly valuable for product managers, product owners, business analysts, project sponsors, C-level stakeholders, and other decision-makers. Our ranking shows that, for the CRUD workload, the difference in PPR between databases can reach up to 300 ops/sec/$ in a single test run. Even smaller differences — just a few dozen operations per second per dollar — can add up substantially at scale, especially in data-intensive or real-time environments.
The example below demonstrates how different databases, and even different versions of the same database, can yield throughput-per-cost ratios that vary by several factors.
UC3: Compare the Performance of a Database on Different Clouds
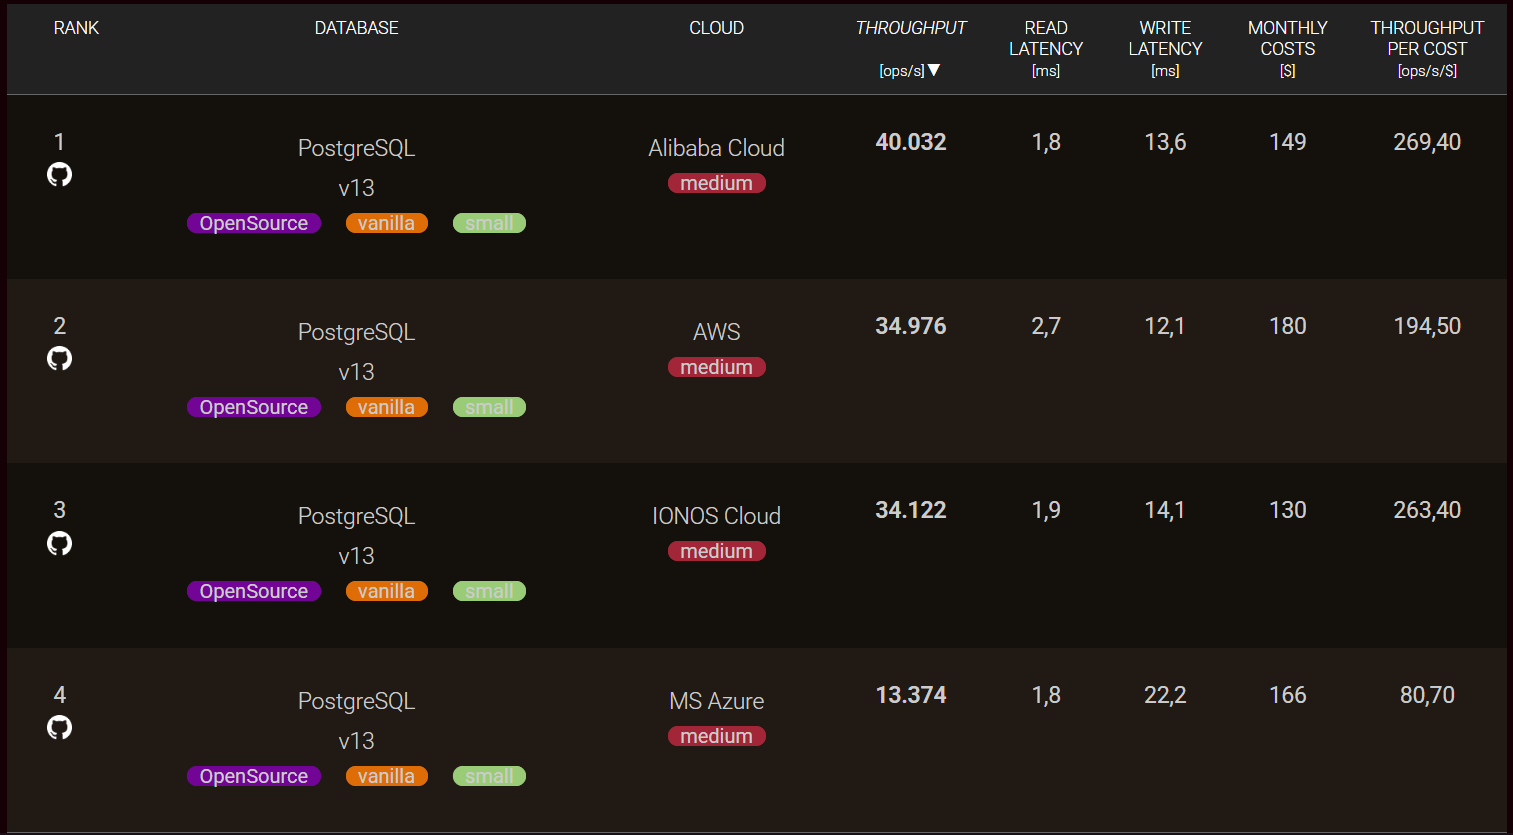
You can also compare the performance of the same database across different cloud providers. This type of evaluation is especially valuable for DevOps engineers and cloud architects, as it helps identify opportunities to optimize infrastructure and maximize system performance.
At the same time, solution architects planning cloud migrations or implementing multi-cloud strategies can use these comparisons to gain a clearer understanding of the performance and efficiency trade-offs between different cloud environments.
UC4: Compare Cloud Providers’ Price–Performance for a Database
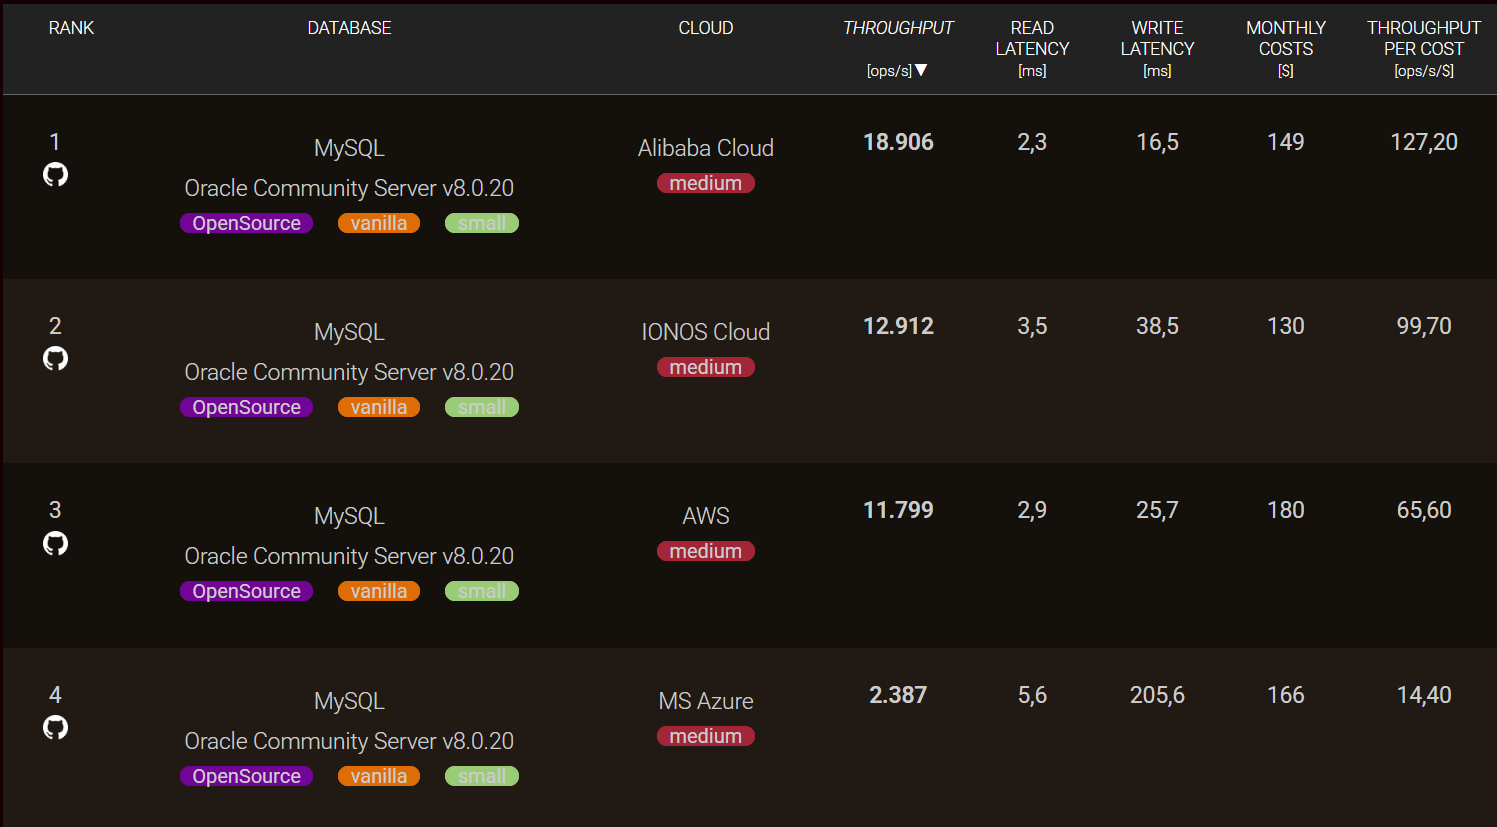
Another valuable use case is comparing the price–performance ratio of the same database across different cloud providers. This analysis helps identify where you can achieve the best balance between cost and performance.
Such insights are particularly useful for product managers, financial analysts, and cloud operations teams when estimating infrastructure spending — for example, during expansion into new regions or availability zones, or when designing a multi-cloud environment.
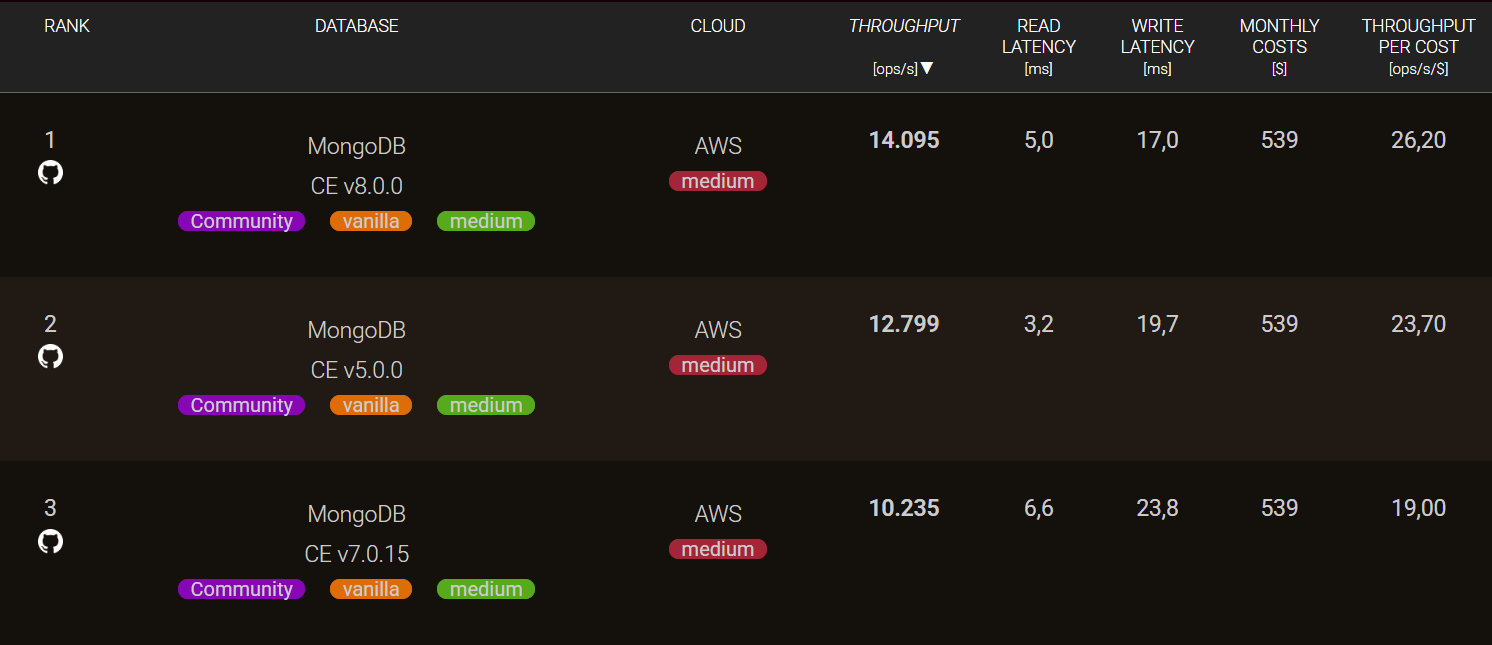
UC5: Compare the Performance of Different Database Versions
You can also compare the performance of the same database across different versions (for example, MongoDB v8.0.0 vs. v7.0.15 vs. 5.0.0).
Benchmarking in this way helps you evaluate whether upgrading provides tangible performance benefits over your current configuration. It can also reveal if a newer version might negatively affect your system, since new does not always mean faster. By testing and analyzing version differences in advance, you can make informed upgrade decisions and avoid unnecessary or costly rollbacks.
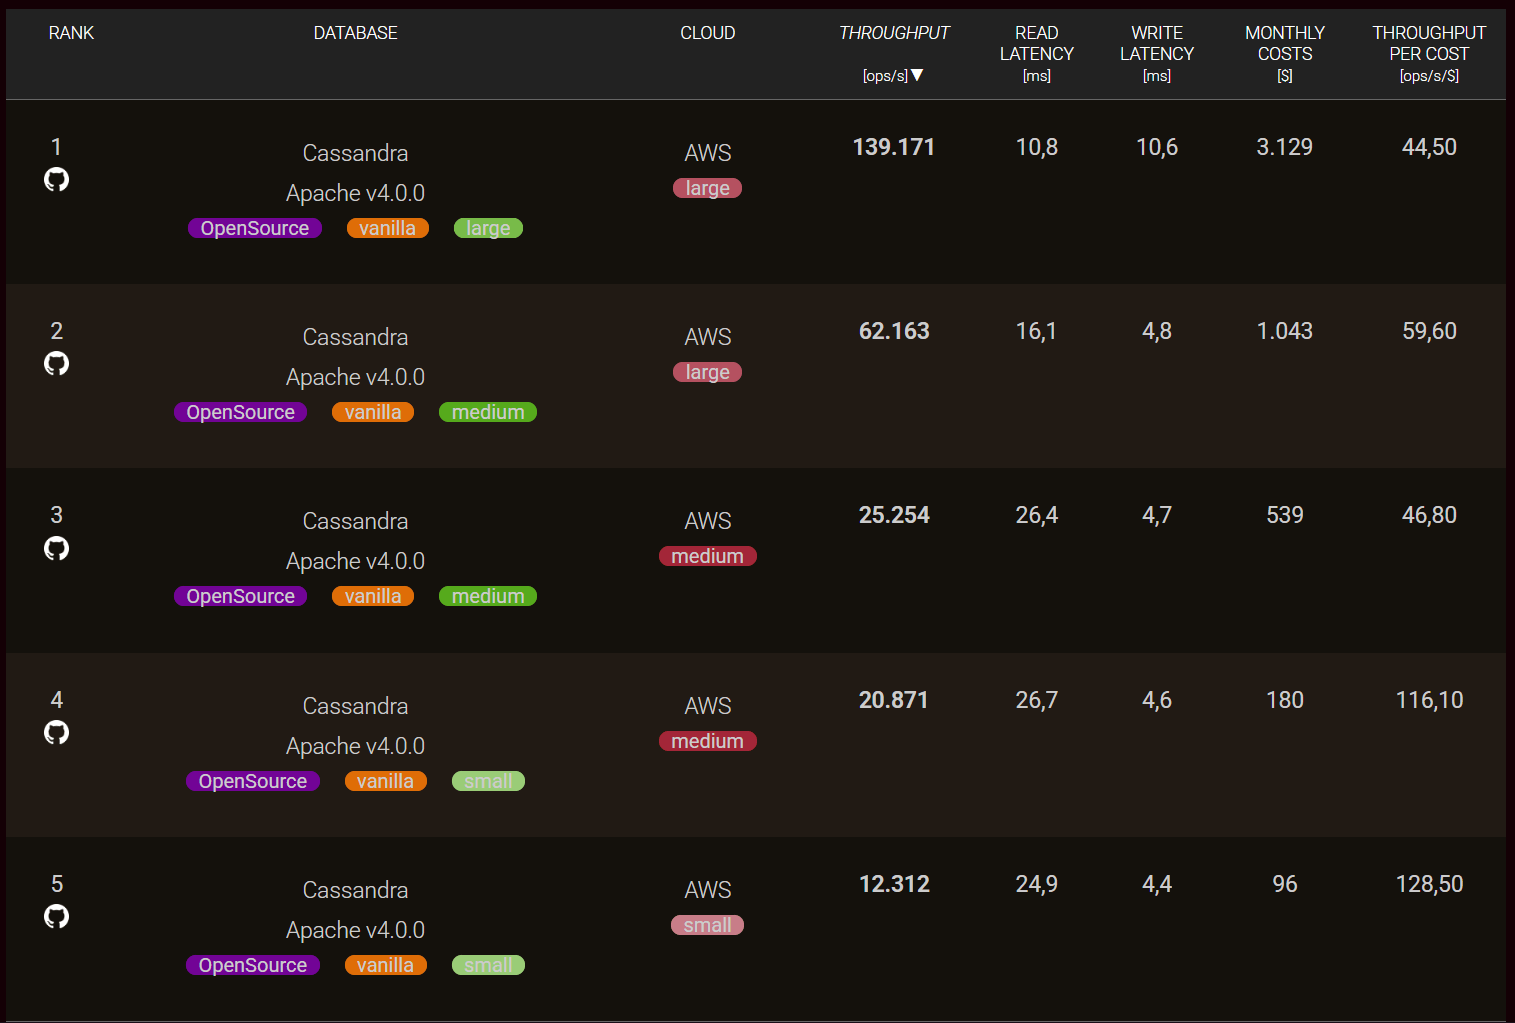
UC6: Compare the Scalability of Different Database Systems
Beyond comparing cloud vendors, you can also analyze how databases scale across clusters of different sizes within the same cloud provider. In this use case, databases can be evaluated under multiple cluster configurations — for example:
- xSmall: 1 node on a small cloud instance
- Small: 1 node on a medium cloud instance
- Medium: 3 nodes on a medium cloud instance
- Large: 3 nodes on a large cloud instance
- xLarge: 9 nodes on a large cloud instance
This data allows you to determine which scaling approach is more effective for your needs — horizontal scaling (adding more nodes) or vertical scaling (using larger instances). By comparing scalability patterns, you can better plan database architectures that balance performance, cost, and resource utilization.
Summary and Outlook
The benchANT Database Performance Ranking consolidates the latest benchmark results across cloud providers and database systems, offering deeper insights into throughput, latency, and price-performance metrics. Stay tuned for a continuously evolving ranking: in the coming months, benchANT will release a new user interface, expand the ranking with more databases, and introduce dedicated DBaaS performance rankings.