
Benchmark Study
AWS EC2 vs Open Telekom Cloud vs IONOS Cloud
This article discusses the price-performance trade-offs when selecting a cloud provider for a specific database set-up. More precisely, we investigate how a 3-node MongoDB cluster performs on various virtual machine flavors of different cloud providers using a write-heavy workload. All flavors we use, run with 2 virtual cores (as selected in the cloud provider API) and make use of 8 GB of memory. Overall, we picked 6 flavors from the German cloud provider IONOS, 4 flavors from the German cloud provider Open Telekom Cloud (OTC), and 4 flavors from market leader Amazon Web Services/EC2. We apply the widely used Yahoo Cloud Serving Benchmark (YCSB) to fill the database initially with 2,000,000 items of 5kBit items size. Our YCSB workload configuration executes 10,000,000 operations with 80% writes and 20% reads as it can be found in many IoT scenarios.
Using our benchmarking platform benchANT, we identified several surprising and counter-intuitive results that show that benchmarking is necessary in advance to selecting a cloud provider and a cloud flavor type. The key insights of our research are the following:
- Costs are varying tremendously between flavors and offerings. The cheapest setup is around 170 € while the most expensive one is above 360 €.
- The smaller cloud providers can compete with AWS in terms of throughput, read latency, and write latency. In terms of cost the well performing solutions are more expensive than the AWS configurations (worse performing). Yet, considering price for value, the two small providers top out higher than AWS.
- AWS has an astonishing stability across all flavors when it comes to value for money. The other two cloud providers are a lot more versatile over their flavor spectrum.
- For write-heavy workloads MongoDB does not perform worse when run on HDD instead of SSD when journaling is disabled. Indeed, there may even be performance benefits when using an HDD. This could be a consequence of MongoDB’s internal workings, but may also be caused by the fact that I/O bandwidth is limited by some cloud providers: The bandwidth for SSDs growths with the size of the storage volume, while HDDs have a fixed bandwidth.
- There is no one size fits all flavor performing good for all KPIs under investigation. For instance, flavors with excellent write latency are not necessarily the ones performing good for the read latency; and expensive flavors are not always high-performance flavors. In particular, a flavor running HDD is amongst the cheapest, but still the best when it comes to write latency. Yet, it is the by far worst, with respect to read latency.
These results indicate clearly that there is a significant need for reliable, easily accessible, and comprehensive data on performance and other KPIs of different database-cloud configurations on a per workload bases. The right choice can save up to 190 € (50%) per month for a three-node cluster or increase measured performance by a factor of three. benchANT offers a reliable, easy-to-use, Web-based self-service platform to evaluate beforehand and helping you to make the right decision.
Introduction
When migrating your application to the cloud it is important to decide on a cloud provider and further on specific virtual machine flavors that host the components of your applications. While the number of cloud providers on the market lies in the range of several dozen, the number of flavors per provider may very quickly reach several thousands. In addition to that, almost all cloud providers recommend their customers to verify that the configuration they chose is suitable for the kind of workload they plan to run on that configuration.
Yet, this decision is a difficult one to make as, in lack of appropriate tools, it requires to carefully determine an application’s needs with respect to hardware resources. Often, this also involves understanding the usage patterns from the application and hence, is dependent on users. Having that information at hand, it is further necessary to run carefully designed benchmarks against a set of flavors possibly involving different cloud providers.
With that many available flavors, the search for the right one is looking for a needle in a haystack and due to lack of proper tooling, leads to a long and error prone process to find the right configuration. In consequence, IT decision makers often neglect this important phase of decision making and instead rely on estimates, gut feeling and other rather imprecise measurements.
In this paper, we show how important it is to compare the performance of different dedicated flavors in the context of the application. Instead of relying on micro-benchmarks in order to evaluate the performance of virtual machines, we apply a database-specific macro-benchmark to freshly installed MongoDB instances set-up in a 3-node cluster with a replication degree of 3. Doing so, we expect to answer the following questions:
- The various optimized flavors cloud providers offer show different behaviour when used in a micro-benchmark setting. Yet it is unclear if this difference is also visible when using the flavor in a concrete data-intensive macro-benchmark? Through this, we also address the question of whether the pricing difference really pay off in terms of performance?
- How do the offerings from different cloud providers compare to each other in a data-intensive macro-benchmark? Are there significant differences regarding costs and performance amongst the providers? Do smaller cloud providers fall off compared to AWS as the market leader.
This document is structured as follows: In the next sections, we highlight the key findings of our study. We ran a write-intensive macro-benchmark against various virtual machine flavors of the three cloud providers IONOS, Telekom, and AWS. This is followed by a conclusion. The annex comprises our evaluation methodology, introduces the cloud providers and their offerings, and presents a more technical analysis with more graphs and discussions.
Finding 1: Small cloud providers can compete with AWS
The two rising cloud providers IONOS and Open Telekom Cloud can compete with AWS in terms of throughput, read latency, and write latency. In terms of cost the well performing solutions are more expensive than the AWS configurations. The latter, however, do perform worse.
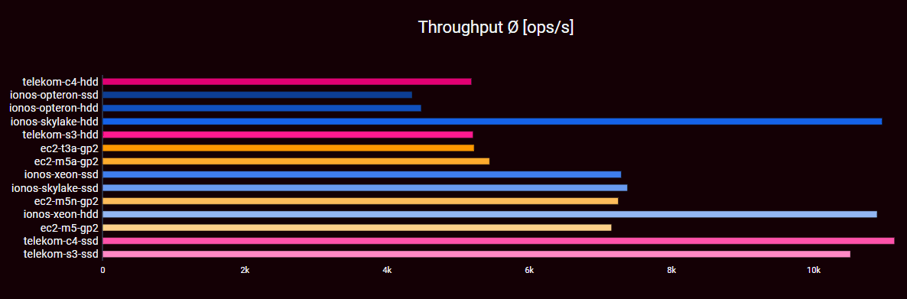
Looking at mere throughput [higher is better] measured in operations per second, large differences between the flavors become visible. Four clusters of data are visible.
The first group contains the four top performers that reach more than 11,000 operations per second on average. The second group containing another four flavors reaches around 7,000 operations per second on average. This is already one third less than the first group. The third group with again four flavors reaches around 5,000 operations per second, while the slowest group of two flavors barely exceeds 4,000 ops/s. The small cloud providers range at the top of the spectrum with two flavors each.
The best performing configurations are Telekom’s c4 and s3 flavors configured with SSD storage and IONOS’ Skylake and Xeon flavors with HDD configuration. The worst performing options are IONOS two Opteron configurations.
Finding 2: Costs vary tremendously
Cost-wise (lower is better), we see a very diverse picture when comparing the providers based on their on-demand per-hour pricing model. Overall, the costs per month for compute and storage ranges from roughly 180 € to more than 360 € for the entire three node cluster.
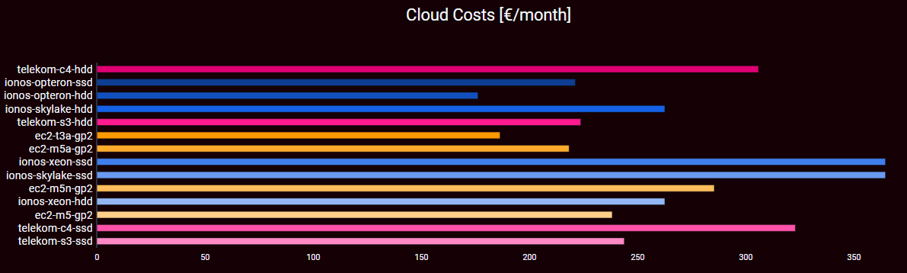
Both minimum and maximum are due to IONOS. Three flavors are in the range of 200 €, two more right below and three more right above 250 €. Finally, two Telekom flavors exceed the 300 € threshold, while two IONOS flavors even exceed the 360 € boundary.
This spread is of prices is so high even though our evaluation only compares flavours that look identical in their specification and offer 2 CPU cores and 8 GB of RAM. Overall, there are many more flavors available with an even wider price range. This makes clear that a thorough investigation and comparison of cloud offerings is necessary. This holds the more as cost can never be the only selection criterium.
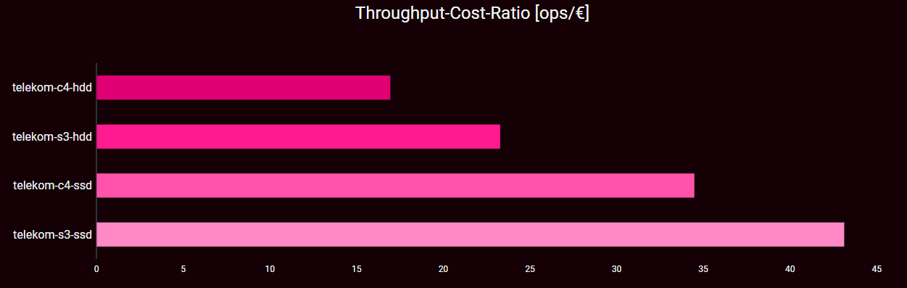
Finding 3: Small cloud providers have best, AWS have stable value for money
The throughput per cost ratio (ops per second and €) [higher is better] shows a range from 20 ops per second and € up to almost 44 ops per second and €. The top values are reached by three flavors of the Telekom and IONOS. In case of Telekom, their s3 flavor backed with SSDs performs best, for IONOS these are Skylake and Xeon flavors with HDD backend.
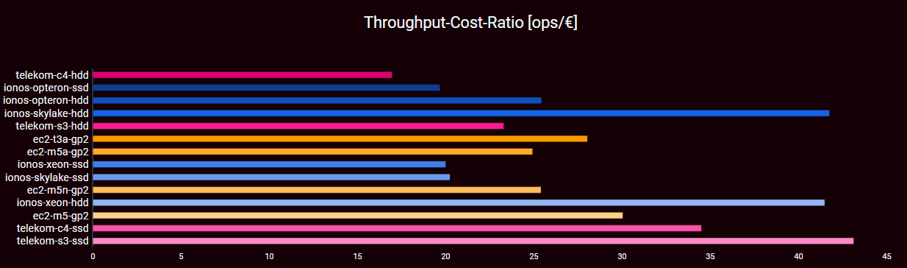
The AWS flavors show very stable throughput per cost values between 25 and 30 operations per second. This may be a consequence of AWS being in the business for a long time and indicate that AWS knows their offering very well. Both IONOS and Telekom have a much wider spread. They not only provide the best throughput per cost, but also the worst (Telekom, c4 with HDD) and worst but last (IONOS, Skylake and Xeon with SSD backend) respectively.
Finding 4: For writes MongoDB does not care about SSD or HDD
The data for the average write latency [smaller is better] also show a huge spread. The highest latency is at 15ms, while the lowest tops out below 5ms (factor of 3). Overall, two IONOS HDD and two Telekom HDD flavors provide latencies below 5ms, while two Telekom SSD flavors are just right above. The second plateau is at 8-9ms and comprises two AWS flavors and IONOS’ SSD flavors. At the end of the field reside AWS’ t3a and m5a flavors only defeating IONOS’ Opteron-based flavors.
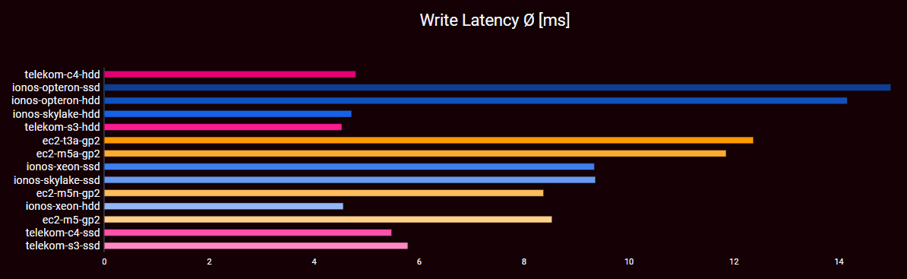
The conclusion to draw here is that for write-heavy workload MongoDB does not perform worse when run on HDD instead of SSD when their journaling feature is disabled. In the case of IONOS, there is even a massive performance boost when using HDDs. A similar, yet less strong effect is visible in the case of Telekom. This could be a consequence of MongoDB’s internal workings, but may also be caused by the fact that for IONOS SSD I/O bandwidth is strongly limited by the cloud provider. Here, the bandwidth for SSDs growths with the size of the storage volume. For HDDs there is a fixed bandwidth.
Finding 5: There is no silver bullet
The radar charts show the qualities of all investigated flavors for the four KPIs throughput, write latency, read latency, and cost. The scale ranges from 0 to 5 with 4(3) indicating better(worse) results than the average and 5(1) indicating extremely better(worse) results than the average. For details about the scales, please refer to “The benchANT score” in the annex.
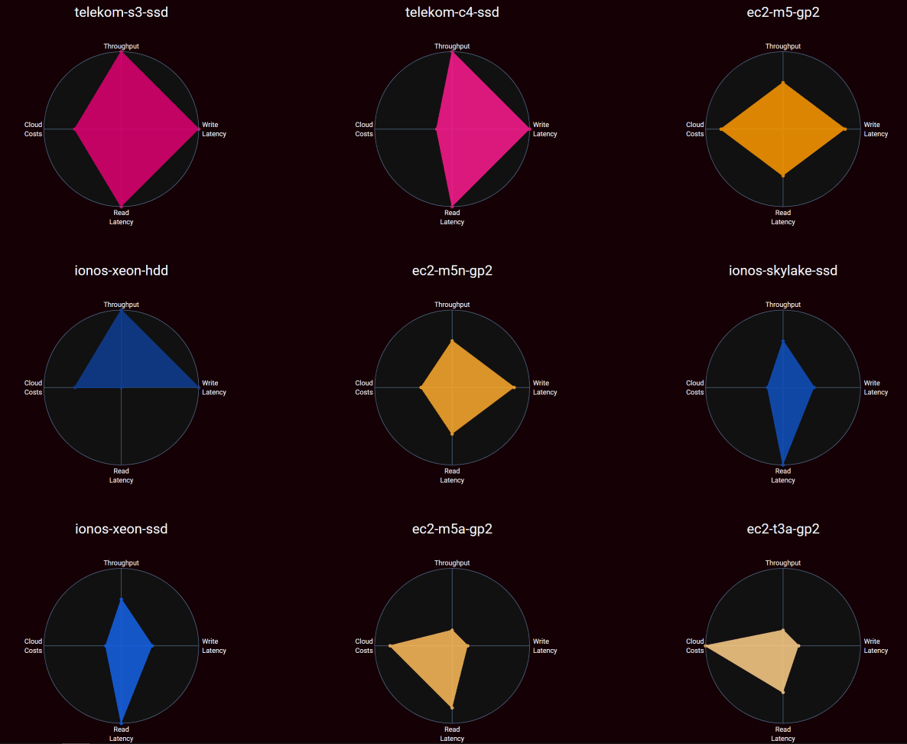
The radar charts are all different indicating that no two configurations look alike. Further, there is no set up dominating all other set ups. Hence, there is no one size fits all flavor performing good for all KPIs under investigation. This is the case even though we only selected flavors that have the very same hardware specifications.
For instance, flavors with excellent write latency are not necessarily the ones performing good for the read latency; and expensive flavors are not always high-performance flavors. In particular, a flavor running HDD is amongst the cheapest, but still the best when it comes to write latency. Yet, it is the by far worst, with respect to read latency.
Results Overview
In this whitepaper we have investigated the behaviour, pricing, and performance differences of various two core-8 GB RAM flavors of the three cloud providers IONOS, Open Telekom Cloud, and AWS using multiple storage backends when running MongoDB under a write-heavy workload. The study yields several interesting findings such as:
- AWS is not necessary the best performing cloud provider. Rising cloud providers such as IONOS and Open Telekom Cloud can compete and even outperform AWS in several domains.
- For write operations MongoDB’s performance is better when using an HDD backend compared to an SSD backend.
- There is a large spread between the various flavors for all investigated KPIs, particularly when it comes to pricing and throughput. The difference between the cheapest and most expensive flavor is more than 200 €. The flavor with the highest throughput has three times more operations per second than the flavor with the lowest throughput.
- The use of expensive flavors does not necessarily result in high performance.
The winners in the individual categories are:
- Write latency: Telekom s3.large.4 with HDD backend
- Read latency: IONOS Skylake flavor with SSD backend
- Throughput: Telekom c4.large.4 with SSD backend
- Costs: IONOS Opteron flavor with HDD
- Price per value: Telekom s3.large.4 with SSD backend
This list gives evidence that that there is no one size fits all flavor coping best with all five KPIs we have put up. This makes clear that a detailed, case-specific performance-cost trade-off analysis is needed before choosing a flavor for an application.
This is holds even more as the evaluation we presented in this paper only captures a very tiny space of the overall possible configuration space. Further investigations worth doing include
- The evaluation of other, particularly larger and more specialized, flavors
- The evaluation of different replication and consistency settings for MongoDB
- The evaluation of further database management systems beyond MongoDB
- The evaluation of different workloads, particularly those that are less write intense
benchANT provides powerful tooling through an easy-to-use platform to perform the necessary benchmarks, to process, and visualize the results.
Technical and Methodologic Details
In the following, we cover the evaluation methodology we used for producing the data presented in this document. Furthermore, we discuss the individual configuration options we chose for the evaluation. Finally, we provide a much more in-depth discussion on the results and present further graphs and data.
Methodology
With the cloud provider offerings being the main subject of investigation in this study, we fix many of the other parameters of a benchmark. This means the results we present here only hold for the selected database in the given configuration and the selected workloads. Turning to a different database, choosing a different database configuration, or running a different workload against the database will very certainly give different results. benchANT helps you to compose your experiments and offers an easy-to-use Web interface for doing so supporting a large set of databases, cloud flavors and workloads.
On a high level, the decisions we made for the evaluation are as presented below. The exact details are presented in the next section.
- As Database Management System (DBMS, short: database), we select MongoDB which is the most widely used open-source NoSQL database. We use the community edition of MongoDB due to its ease of access.
- Regarding the workload, we focus on a write-heavy workload, with a bit (20%) of read operations. This is workload is for instance found in IoT environments, in systems monitoring, and in partially in data analytics. For implementing the workload, we use the Yahoo Cloud Serving Benchmark (YCSB), a tool widely established for benchmarking NoSQL databases in industry and academia.
- The cloud providers we chose are the two large German cloud companies IONOS and Telekom Open Cloud as well as Amazon EC2. IONOS and Telekom are rising competitors, while AWS is the market leader in the cloud computing domain with a market share of more than 30%. For each of the cloud providers we chose flavors that offer the same CPU and RAM configuration, 2 cores and 8 GB of RAM. Further, for being able to cope with the data generated during the benchmark, we allocate 100GB of storage for each flavor. Here, we vary between HDD and SSD configurations with a monthly price up to 50€.
- The KPIs we use to compare the different flavors with a database workload is the monthly costs for running the set-up (based on provider pricing for flavor and storage), the throughput of the solution in sense of requests per second (combining read and write performance in one metric), and finally the average latency of write operations as well as read operations. Aligned with scientific literature, we use the average, the 95th percentile, and the 99th percentile for these values.
- In addition to individual KPIs, we further compute our benchANT score that combines all individual KPIs producing a single number one can use to get a tentative estimate how good a single configuration point is relative to all other configuration points under test.
Configuration Points
In this section, we detail the configuration we used with respect to MongoDB, Yahoo Cloud Servicing Benchmark, and cloud flavors. This section can safely be skipped in case you are only interested in the results.
MongoDB configuration: For MongoDB, we run MongoDB 4.4.2 in a 3-node cluster set-up consisting of a primary and two secondaries. We did not use sharding and applied a replication factor of “3”. Hence, the data set is fully replicated so that each MongoDB instance holds the entire data set. The default consistency settings were chosen such that they represent a rather weak consistency. Particularly, a write concern of 1 is used, while for reads the read concern was local. Journaling was disabled.
Workload: We picked a write-heavy workload where YCSB is configured such that in the load phase the database is initially filled with 2,000,000 items with an item size of 5 kB. During the workload phase 10,000,000 operations with a 80-20 write-read distribution are executed. The read operations are performed according to a uniform distribution. The workload is executed by 64 YCSB worker threads with a maximum runtime of 30 minutes.
Cloud providers: For the evaluation, we use the IaaS offerings of three cloud providers: Amazon EC2, Open Telekom Cloud, and IONOS Cloud. For each of them, we chose multiple different configurations and compare these against each other. Before detailing the chosen configurations, we present background on the cloud providers and their offerings.
Amazon EC2
Amazon EC2 is the longest available and probably most popular IaaS offering worldwide. They are the market leader with a market share of more than 30%. Their cloud offering is very broad and fully differentiated. When it comes to IaaS virtual machine flavours, AWS offers several thousand different flavour types consisting of general-purpose flavours and flavours marketed as specialized for specific scenarios. Their service is available in several dozen data centres (regions) across the world.
With respect to storage, AWS’s offering is similarly fine-grained and requires a detailed understanding of configuration subtilities. In brief, AWS EBS is the block storage attachable to virtual machines. Here, three different types of storage are principally available: standard SSD volumes (gp2 and gp3 types), io-optimized SSD volumes, and HDD-based volumes.
For the current whitepaper, we select four different AWS flavours summarised in Table 1. All of them have assigned 2 cores and 8 GB of RAM. The m5.large flavor is a general purpose flavor built on the Intel Xeon Platinum 8175M processors. According to AWS these flavors are suited for small and medium sized databases and data processing tasks. The m5a.large flavor is very similar, but instead runs on an AMD EPYC 7000 processor. The processor frequencies are 3.1 (Intel Xeon) and 2.5 GHz (AMD EPYC) respectively. m5n flavors are similarly suited for small and medium sized databases and further come with an increased frequency of 3.5 GHz. The t3a.large flavor is the cheapest of all AWS flavors. It is also a general purpose flavor, but more suited for bursty workloads. It also uses an EPYC 7000 processor.
| ID | Description | Physical Processor Type | $/h |
|---|---|---|---|
| m5.large | Purposed for small and medium DBMS | Intel Xeon® Platinum 8175M | 0.096 |
| m5a.large | General purpose | AMD EPYC 7000@2.5GHz | 0.086 |
| m5n.large | General purpose with extended networking capabilities | Intel Xeon 8175M | 0.119 |
| t3a.large | General purpose with performance credits | AMD EPYC 7000@2.5GHz | 0.0752 |
For the current investigation, we exclusively make use of GP2 storage type. GP2 is one of the two currently available general purpose (GP) SSD types. GP2 volumes are remote to a virtual machine and provide as elastic block storages (EBS). The exact technical specifications of GP2 volumes depends on the volume size and the virtual machine type it is attached to. In our case, all four flavors run the nitro system and hence are automatically EBS optimized. Due to that, at most 81 MB/s throughput can be reached for the m flavors. The t3a flavor can reach 87 MB/s. Regarding IOSP, for the three m flavors, 3,600 IOPS are possible, while t3a.large allows for at most 4,000 IOPS. All flavors except m5a can burst to 594 MB/s and 18,750 IOPS for 30 minutes at least once a day. For m5n it is 360 MB/s and 16,000 IOPS respectively.
Open Telekom Cloud (OTC)
OTC is an IaaS offering of Deutsche Telekom. It exclusively addresses business customers and since recently offers data centres in Frankfurt, Germany and Amsterdam, The Netherlands. OTC itself is based on OpenStack and clients can use standard OpenStack drivers to access the IaaS offering using command line tools or scripts.
| ID | Description | Physical Processor Type | €/h |
|---|---|---|---|
| s3.large.4 | General purpose, able to burst baseline; suited for small scale databases | Intel® Xeon® Cascade Lake 6278 | 0.099 € |
| c3.large.4 | Dedicated general purpose; suited for Small- and medium-scale databases | Intel® Xeon® Skylake 6151 | 0.137 |
For the current whitepaper, we select two different OTC flavours in line with the overall flavor specification of 2 cores and 8 GB of RAM. The s3 flavor is a general-purpose flavor based on an Intel Cascade Lake processor. The c3 flavor is based on Intel Skylake processors. From the description on the OTC Web site, there is very little difference between the flavors even though the pricing difference is more than 30%.
| COMMON I/O | HIGH I/O | ULTRA-HIGH I/O | |
|---|---|---|---|
| IOPS [100GB] | 100 | 300 | 5,000 |
| Throughput | 40 MB/s | 120 MB/s | 320 MB/s |
| Price per month [100GB] | 4.60 € | 6.00 € | 10.00 € |
With respect to storage, OTC offer five different types of storage through their Elastic Volume Service. Two of these, however, are exclusively reserved for SAP HANA customers. Hence, what remains are the configuration options “Common I/O”, “High I/O”, and “Ultra-high I/O” that differ with performance characteristics as shown in Table 3.
For this paper, we configure the driver to use the volume types “SATA” and “SSD” that correspond to the Block Storage Types Common I/0 and Ultra High I/O (for the sake of completeness: High I/O is called “SAS” on driver-level). This should give us a good understanding of the differences between performance and cost trade-offs on both ends of the spectrum.
IONOS Cloud
IONOS Cloud is an IaaS offering by the German Telco 1&1 and belongs to United Internet. It exclusively addresses business customers and provides six regions in Europe (4) and Northern America (2). The cloud itself is based on OpenStack with some add-ons so that IONOS provides dedicated drivers to access the IaaS offering using command line tools or scripts. The IaaS offering of IONOS is special in the sense that it does not use pre-defined flavour types but allows the user to define their flavours on a per-core and per-GB-RAM basis. Here, users can chose between three different CPU types (AMD Opteron, Intel Xeon, and Intel Skylake).
In consequence, IONOS does not offer dedicated flavors for special purposes, but it remains the users’ task to figure out how to assemble their virtual machine. In addition, IONOS differs from their competitors as they do not detail which concrete physical processors are being used to run their virtual machines. For the evaluation, we use all three available processor types and configure them such that the overall specification of 2 cores and 8 GB RAM are fulfilled. Not all processor types are available in all data centres, so we use different regions for the evaluation.
| ID | Processor Type | Location | €/h |
|---|---|---|---|
| Skylake_2_8 | Intel XEON Skylake | Berlin | 0.116 |
| Intel_2_8 | Intel XEON Hasswell/Broadwell | Frankfurt | 0.116 |
| AMD_2_8 | AMD Opteron | Frankfurt | 0.076 |
With respect to storage, IONOS offers three different types of block devices named “HDD”, “SSD Standard”, and “SSD Premium”. In contrast to its competitors, IONOS does not set any IOPS, and bandwidth guarantees. Another difference is that the service catalogue explicitly differentiates between random and sequential reads and writes for average and maximum cases. For SSD based storage bot throughput and IOPS increase with the size of the volume up to a maximum value.
| HDD | SSD Standard | SSD Premium | |
|---|---|---|---|
| IOPS [100GB] | 1,100 (write) 1,100 (read) | 3,000 (write) 4,000 (read) | 5,000 (write) 7,500 (read) |
| Throughput [100GB] | 200 MB/s | 50 MB/s | 100 MB/s |
| Price per month [100GB] | 4.00€ | 9.00€ | 19.00 € |
For this paper, we make use of the HDD and SSD Premium configuration. As with OTC this should give us a good understanding of the differences between performance and cost trade-offs on both ends of the spectrum.
In-depth Analysis
In this section, we discuss the evaluation results in deep detail. Yet, we stick to a descriptive level assuming both cloud provider and DBMS as a black box.
Prices are computed based on the official pricing calculator of each provider. They are subject to change so that the price information may be outdated when you are reading this paper a lot later than its publishing date. Further, the costs per configuration have been computed assuming 720 hours per month. This is sufficient to perform a comparison between the flavors, but not for a proper financial planning of one’s cloud cost.
To increase the reliability of our results, all experiments had initially been repeated three times. Results that were non-intuitive (e.g., HDD faster than SSD) or cannot be easily explained were repeated up to ten times at different times of the day to further increase trust in the numbers. There was not a single case where a non-intuitive result was falsified by adding more runs to the evaluation.
This section is structured as follows: first, we look at results from a high-level. Particularly we look on the outcome for the benchANT score. In the next step, we analyse the results individually for each cloud provider. That is, we compare the various flavors of a single provider against each other aiming at identifying sweet spots. Finally, for each KPI we compare the best flavors of a provider to the competitors.
benchANT Score
The benchANT score of all involved flavors is listed in Table 6 and illustrated in the spider charts in Figure 6. Judging from the benchANT score the Telekom SSD flavors are at the top of the list with maximum 18 / 20 and 16 / 20 points. They are followed by AWS’ m5 flavor and IONOS’ Xeon flavor with HDD backend. At the end of the list reside the two IONOS Opteron flavors and Telekom’s c4 flavor with HDD backend.
| SCORE | ID | PROVIDER | FLAVOR | STORAGE |
|---|---|---|---|---|
| 18 | telekom-s3-ssd | Telekom | s3.large.4 | SSD |
| 16 | telekom-c4-ssd | Telekom | c4.large.4 | SSD |
| 14 | ec2-m5-gp2 | EC2 | m5.large | GP2 |
| 13 | ionos-xeon-hdd | Ionos | xeon | HDD |
| 12 | ec2-m5n-gp2 | EC2 | m5n.large | GP2 |
| 11 | ionos-skylake-ssd | Ionos | skylake | SSD |
| 11 | ionos-xeon-ssd | Ionos | xeon | SSD |
| 10 | ec2-m5a-gp2 | EC2 | m5a.large | GP2 |
| 10 | ec2-t3a-gp2 | EC2 | t3a.large | SATA |
| 10 | telekom-s3-hdd | Telekom | s3.large.4 | HDD |
| 10 | ionos-skylake-hdd | Ionos | skylake | HDD |
| 8 | ionos-opteron-hdd | Ionos | opteron | HDD |
| 7 | ionos-opteron-ssd | Ionos | opteron | SSD |
| 7 | telekom-c4-hdd | Telekom | c4.large.4 | HDD |
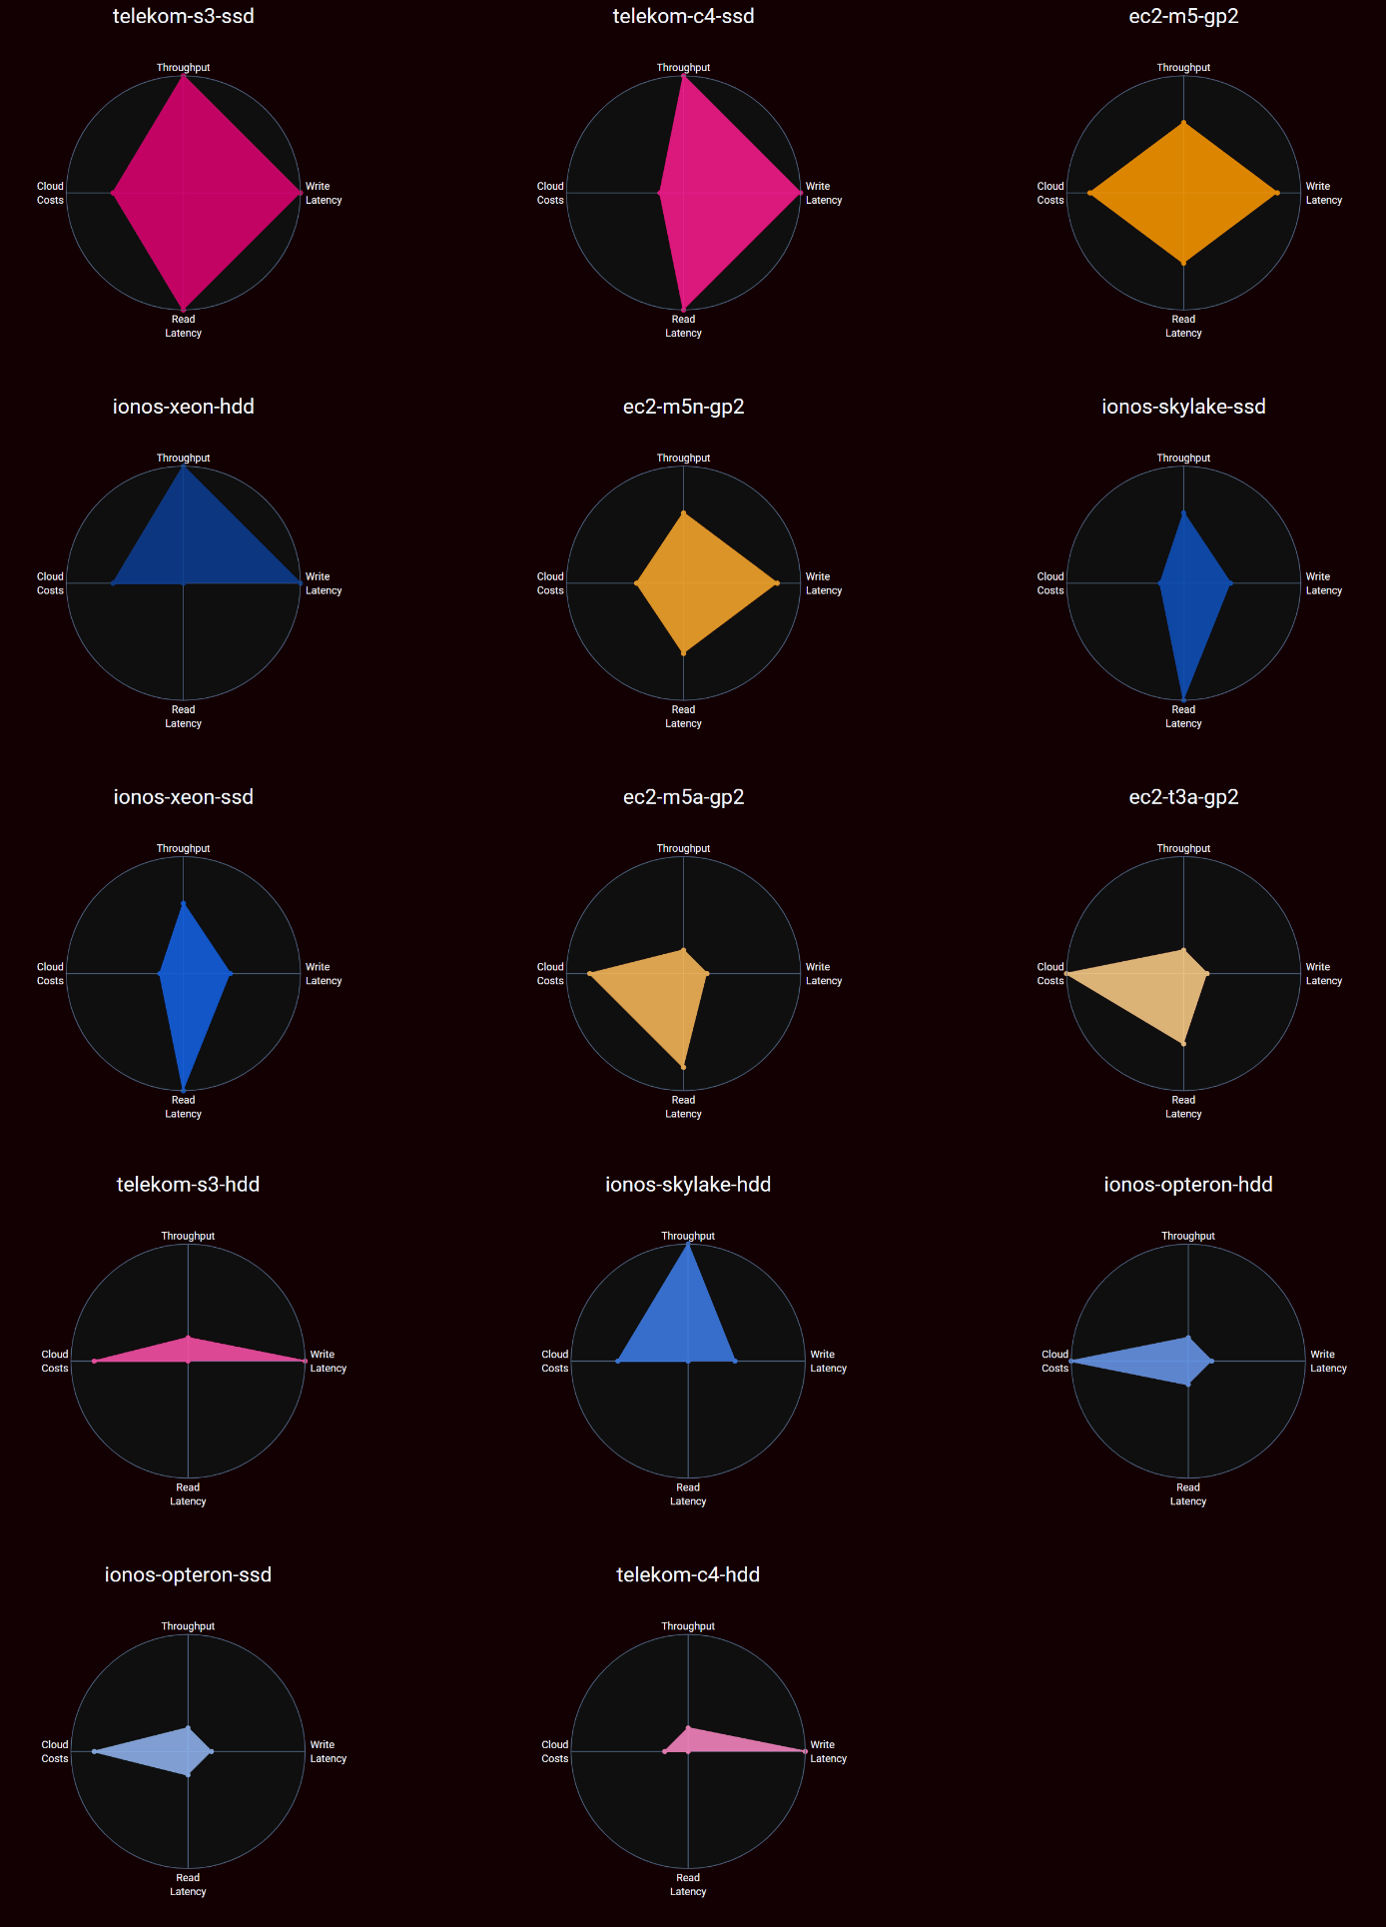
It is easily graspable that no spider chart is alike another which means that the flavors are very different compared to each other. This also means that our investigation is worth doing. Not surprisingly, flavors with good read and write latency also perform very well with respect to throughput. A bit more surprising is the fact that flavors performing bad with respect to read latency, but good with respect to write latency may still reach a very high value when it comes to throughput. This is because our workload has an 80% write proportion.
Regarding costs, we see cheap instances that do not provide very good performance in the other domains. This is what was to be expected. Yet, there are also cheap instances that are excellent in at least one other domain, mostly read latency. One Open Telekom flavor, however, is cheap and provides top stats with respect to write latency. Surprisingly, there are also expensive flavors that do not reach any good results.
What we can conclude form the results so far is that the results are very heterogeneous. This also means that no solution is good in all cases; and motivates an in-depth analysis of the individual results for each provider.
Per Provider Results
In the following, we investigate in more detail the results of the respective cloud providers. The main focus of this section is the comparison of the flavors of each provider with each other. Only towards the end of each section, we compare them against the overall results.
IONOS
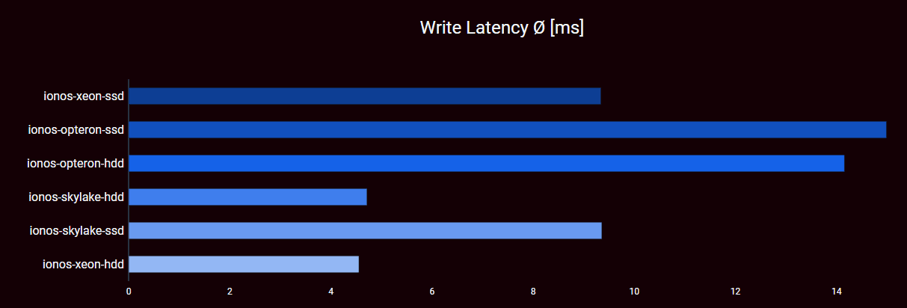
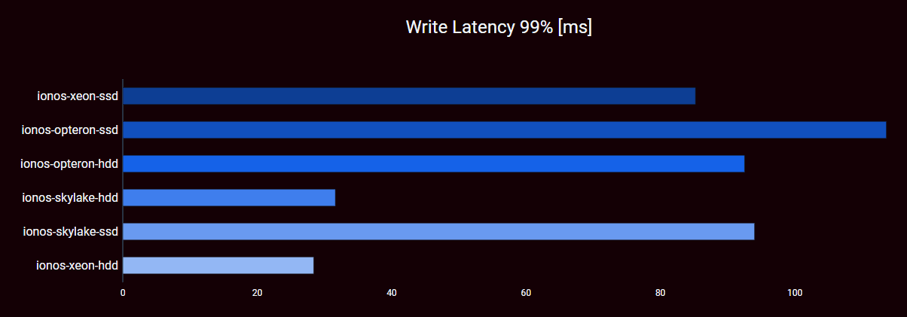
Write Latency by IONOS Flavor Type: When it comes to insert latency for IONOS we see three different levels of average latency for the six flavors used in the experiments: The Skylake and Xeon configurations using HDD top out at a bit over 4.5ms. In contrast their SSD counterparts are slightly above 9.3ms. Finally, both Opteron configurations produce the highest latency, namely between 14 and 15ms, again the HDD variant performs slightly better.
Regarding the 99th percentile, the two Opteron flavors as well as the remaining two SSD configurations produce massive average latencies of 85ms (Xeon SSD), 92ms (Opteron HDD), 94ms (Skylake, SSD) and 113ms (Opteron SSD). The remaining two HDD configurations produce a 99th percentile latency of 32ms (Skylake) and 28ms (Xeon) respectively. Hence, as with averages, the HDD configurations provide the best results for the 99th percentile.
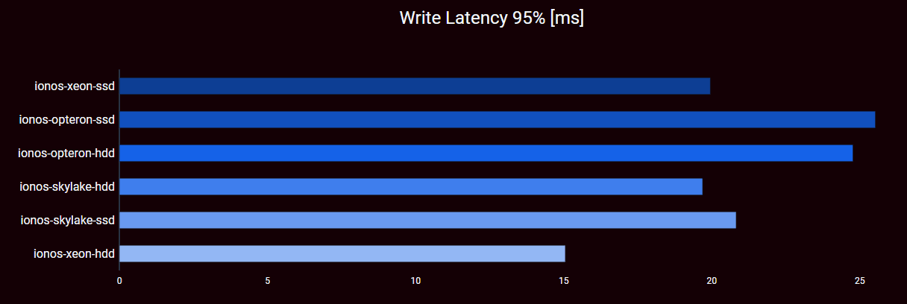
The result for the 95th percentile is similar: the two Opteron configurations are worst with around 25ms. Right behind are the two remaining SSD configurations and the Skylake-based HDD variant (all around 20ms). The best performing configuration is the Xeon HDD version with 15ms.
| ID | AVG | P95 | P99 |
|---|---|---|---|
| Opteron-ssd | 6 | 6 | 6 |
| Opteron-hdd | 5 | 5 | 4 |
| Skylake-ssd | 3 | 4 | 5 |
| Xeon-ssd | 3 | 2 | 3 |
| Skylake-hdd | 2 | 2 | 2 |
| Xeon-hdd | 1 | 1 | 1 |
Bottom line (Write Latency):
- Do not use SSDs for write-heavy MongoDB instances on IONOS
- Do not use Opterons. When using Opterons, do not use SSDs
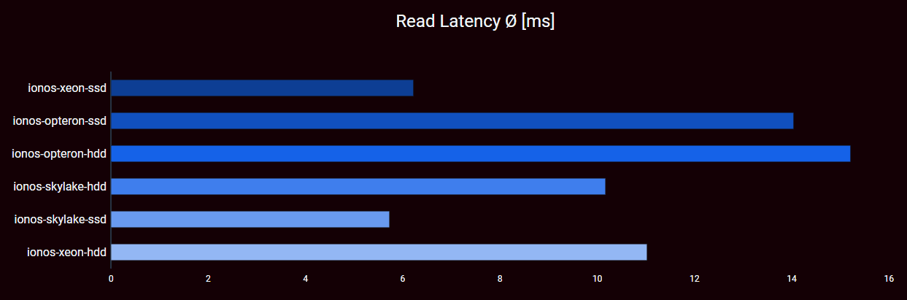
Read Latency by IONOS Flavor Type: When it comes to read latency for IONOS we see again three levels of performance. Skylake and Xeon SSD configurations have lowest latency with slightly below and above 6ms. The second level comprises Skylake and Xeon with HDD storage backend with 10ms and 11ms respectively. The Opteron configurations are last with ~30% advantages for the SSD configuration.
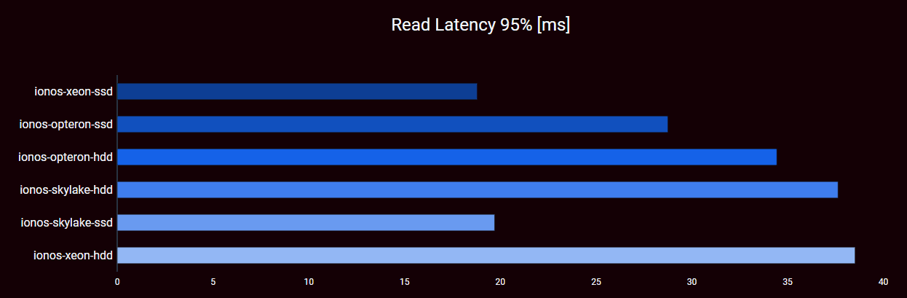
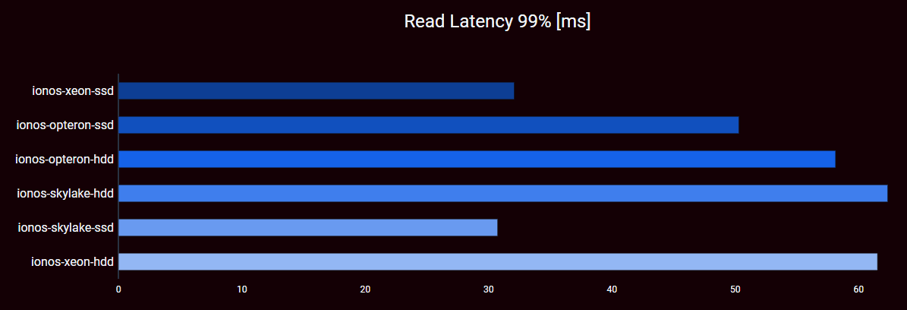
Similarly, for the 90th percentile, Xeon and Skylake with SSD storage perform best (12ms) followed by the Opteron SSD configuration at 23ms. The remaining configurations top out at around 28ms with Xeon/HDD performing worst. The ordering for the 95th percentile is identical and the one for the 99th percentile is also very similar. In the first case, the latencies are around 19ms, 28ms, 34ms, and roughly 38ms. While in the latter case, the latencies are 30ms, 32ms, 50ms, 58ms, and around 62.
| ID | AVG | P95 | P99 |
|---|---|---|---|
| Opteron-ssd | 5 | 3 | 3 |
| Opteron-hdd | 6 | 4 | 4 |
| Skylake-ssd | 1 | 2 | 1 |
| Xeon-ssd | 2 | 1 | 2 |
| Skylake-hdd | 3 | 5 | 6 |
| Xeon-hdd | 4 | 6 | 5 |
Bottom line (Read Latency):
- In contrast to write latency, using an SSD pays off in case of read latency
- For reads, the performance of the Opterons does not fall off compared to Skylake and Xeon
- There are no overshooting latencies for the long tail
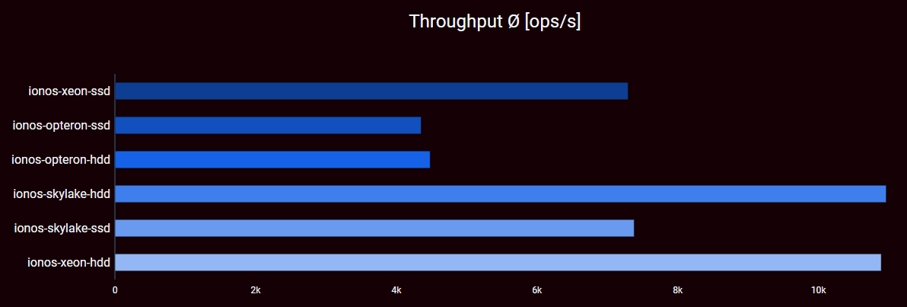
Throughput by IONOS Flavor Type: The throughput comprises all operations executed during the benchmark. In contrast to percentiles, it considers all read and write operations. Particularly in our case, the write performance will have a higher impact than read performance due to the 80% write and 20% read operations in the test set-up. For the IONOS case, we can see three performance plateaus that reflect the plateaus also seen for read and write latency: one plateau around 4.4k operations for the Opteron configurations; one at around 7.3k operations for the Skylake and Xeon SSD configurations, and finally one around 10.9k operations per second comprising the Skylake and Xeon HDD. The latter perform best.
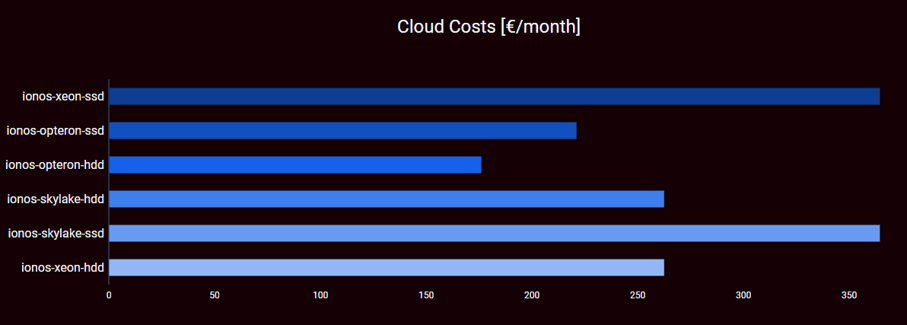
Cost by IONOS Flavor Type: IONOS’ simple pricing model simplifies discussion on costs: Opteron with HDD is cheapest followed by Opteron with SSD. This is followed by Skylake and Xeon processors with HDD; Finally, Skylake and Xeon processors with SSD are most expensive.
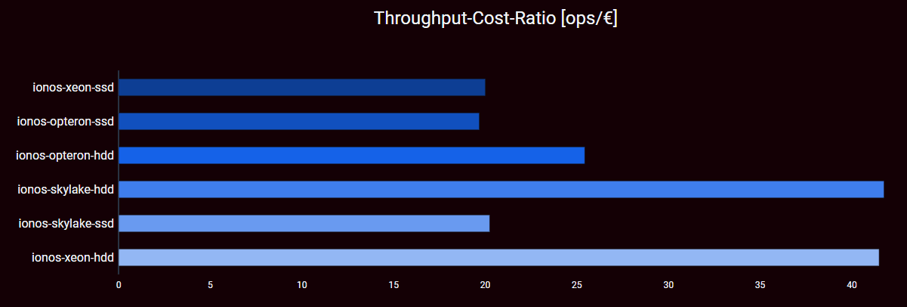
Value for money by IONOS Flavor Type: Since for our set-up Xeon and Skylake HDD configurations provide the best performance and at the same time are offered for the lowest price of all non-Opteron configurations, these two configurations have by far the best value for money with just below 42 operations per second and €. The third place goes to Opterons equipped with HDDs. All SSD nodes are ranked last with a value for money of around 20 operations per second and €.
| ID | Throughput | Costs | Value Ratio |
|---|---|---|---|
| Opteron-ssd | 5 | 2 | 6 |
| Opteron-hdd | 5 | 1 | 3 |
| Skylake-ssd | 3 | 5 | 1 |
| Xeon-ssd | 3 | 5 | 1 |
| Skylake-hdd | 1 | 3 | 4 |
| Xeon-hdd | 1 | 3 | 4 |
Bottom line (Throughput and Costs):
- Do not use Opterons
- Do not use SSDs for write heavy workload
Comparing IONOS to others
Write latency: For write latency, we need to consider both average and percentiles. For the average scenario, two IONOS flavors (Skylake and Xeon with HDDs) are just above 4.6ms. Here only Telekom draws level with their S3 and C4 configuration using Common I/O. On the one hand, these are 40€ cheaper and 40€ more expensive than the IONOS flavors respectively. On the other hand, their read performance is much better than the read performance of the IONOS flavors.
Read latency: In the average case, IONOS provides the flavors with the best read latency. These are the Xeon and Skylake SSD configurations. Both are closely followed by the c4 and s3 Telekom flavors backed with SSDs. The two IONOS flavors are the most expensive in the whole set-up and both Telekom flavors are cheaper. Further, the two Telekom flavors have a more balanced performance when it comes to write latency.
For the 95th percentile, considerations are alike the average case. For the 99th percentile, the gap between IONOS and Telekom increases benefitting IONOS.
Throughput Throughput-wise, the best performing IONOS configurations range between the two best performing Telekom configurations s3 and c4 equipped with SSD. The s3 configuration is roughly 500 op/s (4.5%) worse than the IONOS configurations. The c4 is 1% respectively 2% faster than the IONOS configurations. All four of them are 35% better than the best performing EC2 configuration.
Cost-wise the s3 and c4 configurations are at 244€ and 323€ respectively. This is more than 160€ and 40€ cheaper than the IONOS flavors respectively.
Costs: Regarding costs, IONOS provides the cheapest configuration in the field of competitors (Opteron-HDD). Only AWS has an equally cheap flavor (t3a). Both of them are mediocre with respect to the value for money and bad for throughput, read latency, and write latency. Yet, if performance is not crucial, they are a valid option.
Value for money: Considering throughput per cost, IONOS Skylake with HDD and IONOS Xeon with HDD range at 42 operations per second and €. There is only one configuration beating this, Telekom s3 equipped with SSDs. It comes at slightly lower costs (244€ compared to 262€ for IONOS), but also lower performance (10.5k operations compared to 11k operations).
AWS
In contrast to the two other cloud providers found in this comparison, we only use a single storage backend for AWS, namely the SSD-backed GP2. Hence, we can safely assume that all differences we see in the numbers are not due to the storage backend but caused by the flavor types. Yet, as described earlier, depending on the flavor type, there are slight differences when it comes to the maximum possible performance of the storage backend in terms of IOPS and bandwidth.
Overall, the four AWS flavors have very different characteristics considering the radar charts. The m5 flavor is very balanced in all dimensions yielding scores of either 3 or four. The m5n flavor is identical in all dimensions except costs where the “n” characteristics (extended networking capabilities) causes higher costs at no measurable benefit for our use case. The two other flavors are rather cheap (scoring 4 and 5 for costs respectively) and offer an average to good read latency (scoring 4 and 3). Write latency and throughput both score 1 for both flavors.
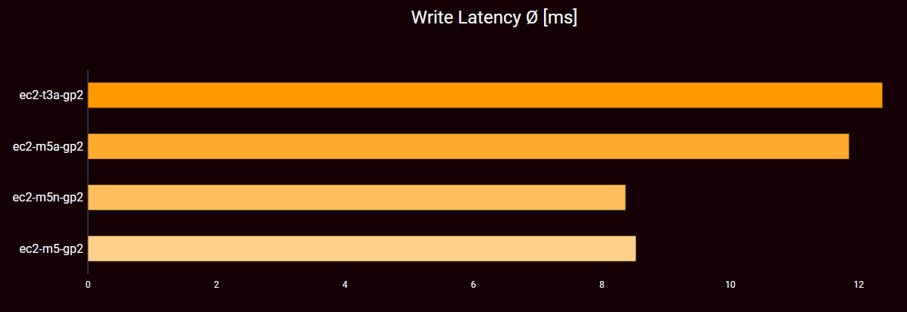
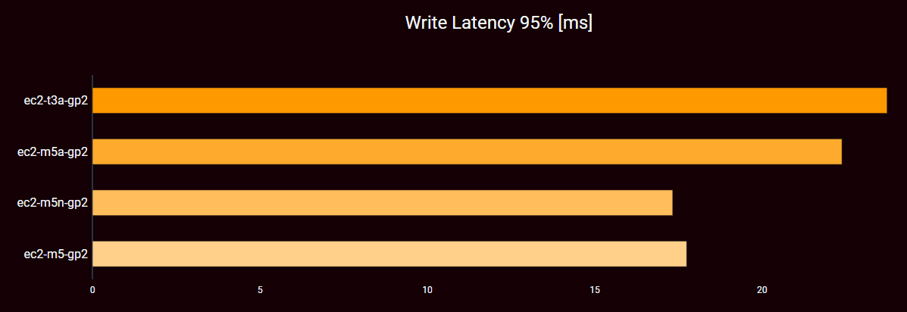
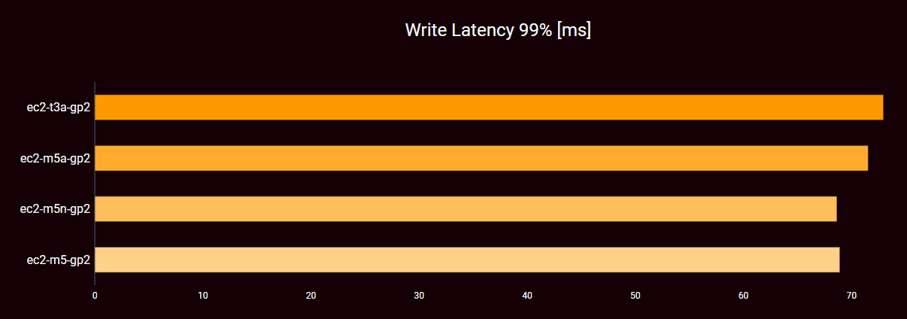
Write Latency by AWS Flavor Type: With respect to write latency, there are two different patterns found in the four configurations. In general, the m5 and the m5n flavor perform better than the m5a and the t3a flavor for average, 90th, 95th, and 99th percentile. Indeed, m5 and m5n produce very similar results and differ only a couple of tenth milliseconds; m5a and t3a also produce similar results, but their differences are in the order of one millisecond.
| ID | AVG | P95 | P99 |
|---|---|---|---|
| t3a-gp2 | 4 | 4 | 4 |
| m5a-gp2 | 3 | 3 | 3 |
| m5n-gp2 | 1 | 1 | 1 |
| m5-gp2 | 2 | 2 | 2 |
Bottom line (Write Latency):
- There is very little difference with respect to insert latency at AWS
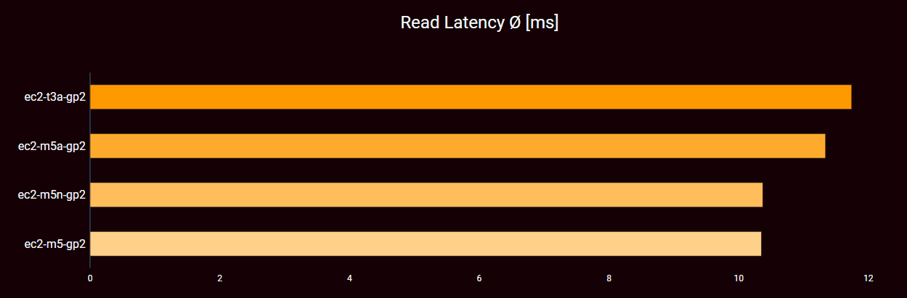
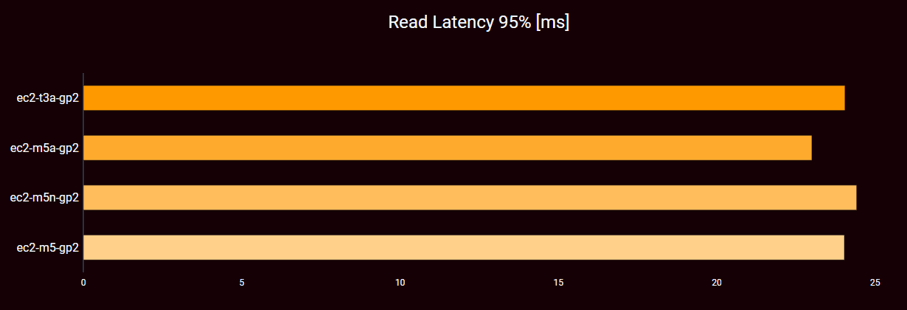
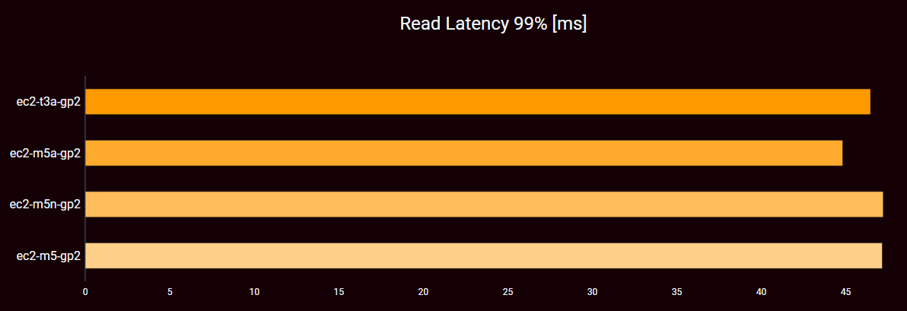
Read Latency by AWS Flavor Type: The read latency we see for AWS is very similar across all chosen flavors. In the long tail, 95th percentile and beyond, there is a slight benefit for the m5a flavor while in the average case m5 and m5n are ~10% faster than the other two. An explanation for this very high similarity between the four configurations is that the read load was not high enough to put significant stress on either the virtual machines or the storage backends.
| ID | AVG | P95 | P99 |
|---|---|---|---|
| t3a-gp2 | 4 | 3 | 2 |
| m5a-gp2 | 3 | 1 | 1 |
| m5n-gp2 | 2 | 4 | 4 |
| m5-gp2 | 1 | 2 | 3 |
Bottom line (Read Latency):
- There is even less difference with respect to read latency at AWS
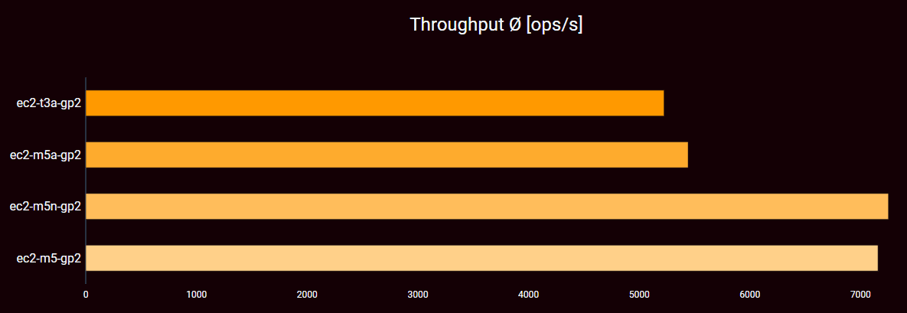
Throughput by AWS Flavor Type: In contrast to read latency, there is a difference when it comes to overall throughput. Here, two plateaus are visible, one right above 5k operations and the other one above 7k operations. As with write latency, the m5 and m5n flavors are better than m5a and t3a.
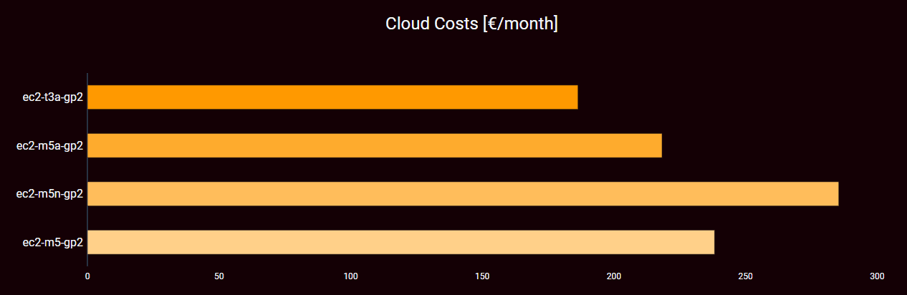
Costs by AWS Flavor Type: When it comes to cost, there is a large span of almost 100 € between the cheapest and the most expensive flavor. Yet, the less performing flavors are also less expensive.
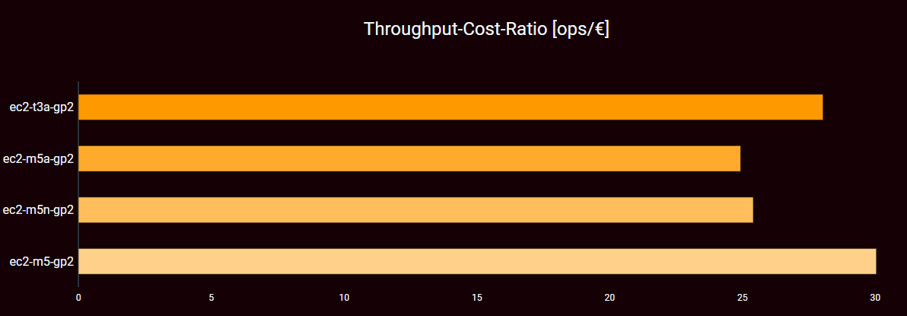
Value for money: As indicated by the costs and throughput, AWS have a very balanced value for money across the four flavor types. M5 is the best with 30 operations per second and euro, followed by t3a with 28. m5a and m5n are almost alike.
| ID | Throughput | Costs | Value Ratio |
|---|---|---|---|
| t3a-gp2 | 4 | 1 | 2 |
| m5a-gp2 | 3 | 2 | 3 |
| m5n-gp2 | 1 | 4 | 4 |
| m5-gp2 | 2 | 3 | 1 |
Bottom line (Throughput and Costs):
- improved network performance does not help our use case
- AMD backed flavors performe worse than the others
- No bursting effect can be measured for the “t” flavor due to not long enough benchmarking periods
- AWS has a very narrow cost band.
- AWS has very stable prices-per-value
- The extra cost the for “n” flavor are only for the network performance and hence, not useful for our scenarios
Comparing AWS to others
Write latency: For write latency, we need to consider both average and percentiles. With respect to the average case, AWS’s best case can be found in the middle of all competitors with two IONOS and four Telekom flavors beating them. The same is true for the 99th percentile. As for the 95th percentile, also four Telekom flavors are better than AWS while only one IONOS flavor is better than AWS.
When write latency is crucial to one’s decision, there is no reason to choose AWS, as flavors from other cloud providers offer a better latency and are not more expensive.
Read latency: Regarding read latency AWS is the middle of the field just as for the write case. m5 and m5n are the two flavors with best average read latency. These are beaten by two IONOS and two Telekom flavors. For the 99th and 95th percentiles all four AWS flavors are in the same range. In both cases two IONOS and two Telekom flavors are better.
When read latency should be used as a differentiator, AWS will probably not be chosen. Yet, if the price is factored in, there is a tight competition with Telekom’s s3 SSD flavor.
Throughput Throughput-wise, the best performing AWS flavors reach around 7.2k operations per second and hence, yield results in line with the second best IONOS flavors. Hence, AWS is performing worse than the best Open Telekom Cloud and best IONOS flavors. Cost-wise the two AWS flavors are a lot cheaper than comparable IONOS flavors. Yet, there are better performing flavors from both IONOS and Telekom that are in the same price range than the AWS flavors so that AWS would probably not be chosen in the throughput domain.
Costs 10 € more expensive than IONOS, AWS provides the second cheapest offering in our evaluation (186 €). The next more expensive offerings come from all three cloud providers and range around 220 €. Performance-wise the cheap AWS flavors are best compared to the other cheap flavors costing 220 €.
Value for money: Considering throughput per cost, all AWS flavors are very homogeneous with a spread of only a bit more than 5 operations per second and €. This is very low compared to the competitors who do have a spread from 17 to 43 operations per second and € (Telekom) and 19 operations per second and €. Overall, the AWS flavors range in the middle of the field.
Open Telekom Cloud (OTC)
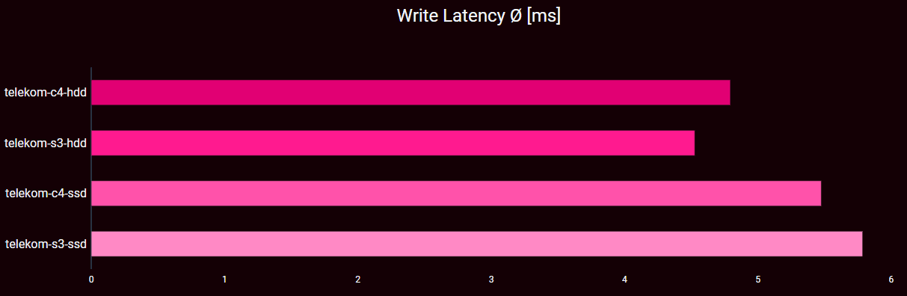
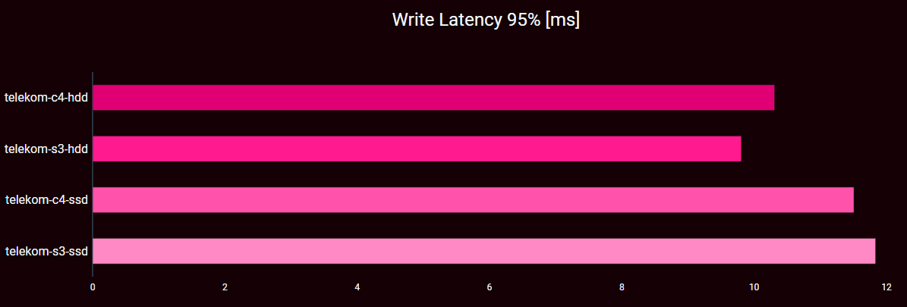
Write latency by OTC Flavor Type: Regarding write latency, the four OTC configurations are very similar in the average case. The overall spread of average latencies lies between 4.5ms and 5.8ms. Surprisingly, the latency of the HDD flavors is better than of the SSD flavors. On the other hand, there is barely any difference between the c4 and the s3 flavor when the same storage backend is used.
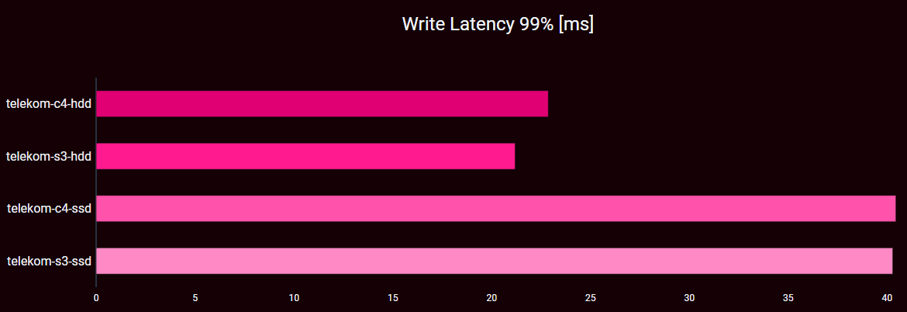
This tendency is also visible in case of the 90th percentile as well as the 95th percentile. In the latter case, the SSD flavors are about 1-2 ms (10—18%) slower than their HDD counterparts. For the 99th percentile, however, the latency in the SSD cases grows dramatically and the SSD configurations are twice as slow as the HDDs.
| ID | AVG | P95 | P99 |
|---|---|---|---|
| c4-hdd | 2 | 2 | 2 |
| s3-hdd | 1 | 1 | 1 |
| c4-ssd | 3 | 3 | 4 |
| s3-ssd | 4 | 4 | 3 |
Bottom line (write latency):
- For write-heavy workload there is very little difference between the c4 and the s3 flavor
- The storage backend dominates performance
- HDD performs better than SSD for write-heavy workloads
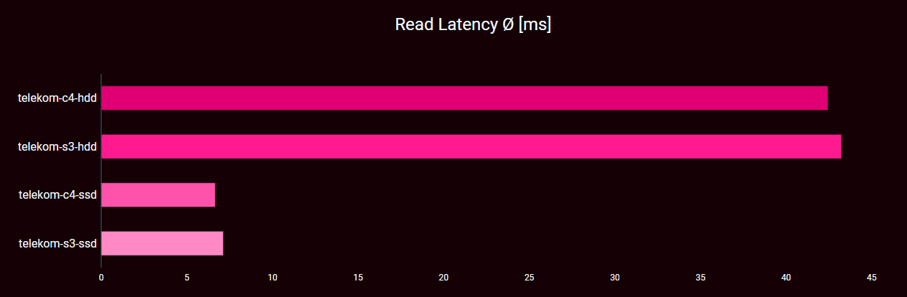
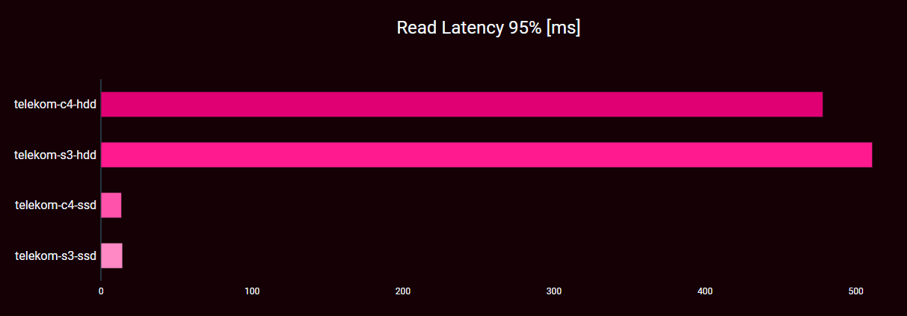
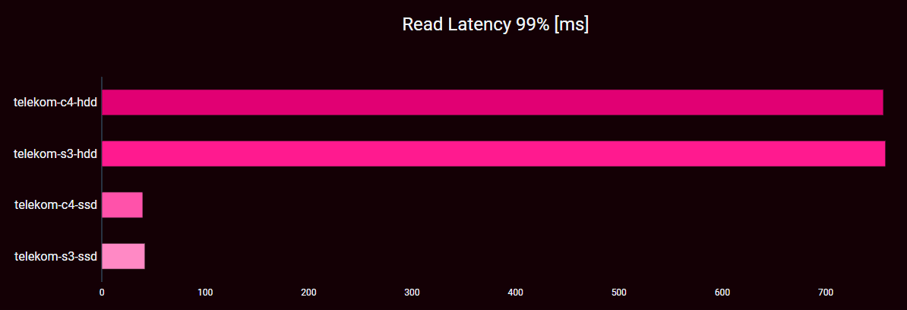
Read latency by OTC Flavor Type: The numbers for read latency are very surprising in several aspects: First, the average latency for the HDD configurations is very high: 42 ms and 43 ms respectively. The SSD configurations range at 6 ms and 7 ms respectively and are comparable to the write latency case. This is even more surprising as the latencies for the 90th percentiles are similar between SSD and HDD variant (still, there is very little difference between c4 and s3). With the 95th and beyond percentiles the values for the HDD case go through the roof, while the SSD values remain in the same order of magnitude as was seen in the write latency case.
| ID | AVG | P95 | P99 |
|---|---|---|---|
| c4-hdd | 3 | 3 | 3 |
| s3-hdd | 4 | 4 | 4 |
| c4-ssd | 1 | 1 | 1 |
| s3-ssd | 2 | 2 | 2 |
Bottom line (read latency):
- There is very little difference between the c4 and the s3 flavor and the storage backend dominates performance
- SSD performs a lot better than HDD, particularly at the tail
- HDD cannot cope with the read demand issued in this write heavy use case
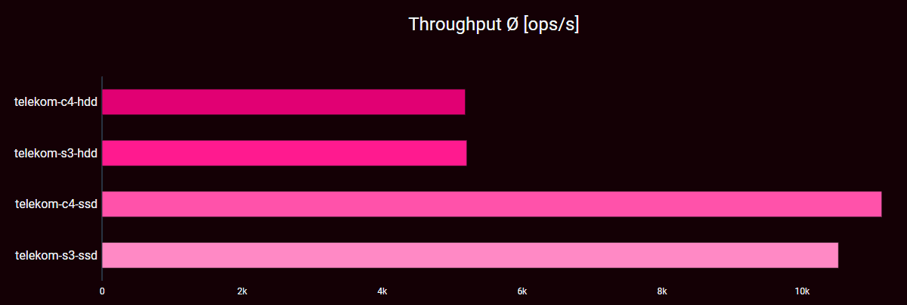
Throughput by OTC Flavor Type: Regarding throughput, we can again state that there is not much difference between c4 and s3. c4 is about 1,000 ops per second (10%) faster than s3 in the SSD case. In the HDD case, both are a lot alike. The SSD throughout is about 100% higher than the HDD case. Despite the low read portion in our workload, the extremely bad performance for HDD case massively impacts the throughput results.
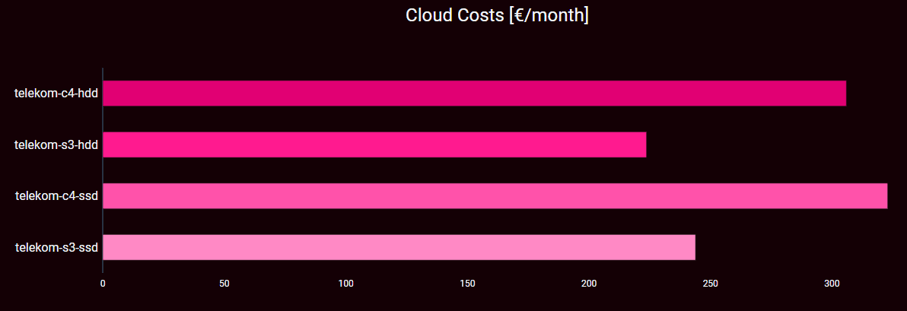
Costs by OTC Flavor Type: The price range offered by OTC starts at 220 € for the s3 flavor with HDD and reaches 320 € for the c4 flavor with SSD. The upgrade from HDD to SSD costs about 20 € As with the other cloud providers, the price of the flavor dominates the overall price.
Price-per-value by OTC Flavor Type: Due to the HDD configurations performing 50% worse than the SSD configurations with respect to throughput, the 20 € increase in price for an SSD-based solution does not carry any weight when considering the price for value. In consequence, both SSD configurations have a clearly better price for value compared to their respective HDD counterparts, but also compared to the other HDD configuration. When it comes to flavors, performance-wise we have not seen any strong differences between the c4 and the s3 flavor. With the higher price of the c4 flavor, it is not surprising that s3 has a much better price for value.
| ID | Throughput | Costs | Value Ratio |
|---|---|---|---|
| c4-hdd | 4 | 3 | 4 |
| s3-hdd | 3 | 1 | 3 |
| c4-ssd | 1 | 4 | 2 |
| s3-ssd | 2 | 2 | 1 |
Bottom line (Throughput and Costs):
- There is very little difference between the c4 and the s3 flavor and the storage backend dominates throughput
- SSD performs a lot better than HDD, particularly at the tail
- The bad read latency dominates throughput as well
- s3 is cheaper than c4, has a better value ratio
- SSDs have a lot better value ratio than the HDDs
Comparing OTC to others
Write latency: For the average write latency, all Telekom flavors are on the top of the ranking. Surprisingly, the two HDD flavors rank best in this category, followed by the two HDD IONOS flavors. The two Telekom SSD flavors are ranked directly afterwards. This tendency also holds for the 95th and 99th percentile. Cost-wise, the two c4 flavor configurations no matter if HDD or SDD-backed are a lot more expensive than the s3 flavor and the HDD Skylake IONOS flavor.
Read latency: With respect to read latency the results are very different. The two Telekom HDD flavors are up to 20x slower than their SSD counterparts. They are also significantly slower than all other flavors in the test. The Telekom SSD flavors in contrast are best in class together with the SSD flavors from IONOS. This is also visible in the percentile cases where IONOS is slightly worse for the 95th percentile; in contrast, Telekom is roughly 10 ms slower at the 99th percentile. As with write latency, there is barely any difference between c4 and s3 performance.
Throughput Throughput-wise, the two Telekom HDD configurations perform almost as bad as the IONOS Opteron flavors, that are the worst in the field. The Telekom SSD flavors are comparable in throughput performance with the IONOS HDD performance.
Costs When it comes to cost, the s3 flavors are relatively cheap and range at the top of the field, but three AWS and two IONOS flavors are cheaper. Value for money: Considering the value for money, Telekom’s s3 SSD configuration is on the same level as IONOS’ Skylake- and Xeon-based HDD flavors.
Glossary
The benchANT Score
The benchANT score is a multi-dimensional-unified scoring algorithm that enables evaluation criteria of different non-comparable dimensions to be combined into a unified score.
The goal is to evaluate the "performance" of different cloud database setups from the multi-dimensional performance metrics - "throughput", "read latency", "write latency" as well as "cloud costs".
Based on this, a ranking will be created, which will allow a pre-selection of the numerous setups for a more detailed analysis. The higher the benchANT score, the "better" the setup is to be classified.
The calculation of the benchANT score is done in 2 steps:
- calculation of the score per performance dimension
- addition of the individual points to the benchANT score.
The first calculation step in particular is not trivial. The calculation is carried out in detail as follows:
- Based on all measurement results of the setups for a performance indicator e.g. "throughput", the median value is determined.
- 3 points: All setups with a result of ± 5%, around the median receive the score 3.
- 4 points: Setups with results that are 5-15% better than the median.
- 5 points: only setups that are 15% better than the median.
- 2 points: Setups with results that are 5-15% better than the median.
- 1 point is awarded for setups that are 15%-50% bad
- 0 points: for outliers below
Note: It should be noted that, for example, "more is better" for throughput, but "less is better" for costs and latencies. A high score therefore always represents a better performing setup.
Percentiles
Just as the benchANT score, a percentile is a score. In brief, in a series of measurements, e.g. derived by benchmarking, the nth percentile gives the value below which n% of all measurements fall. More precisely, a 95th percentile of the write latency at 19 ms means that 95% of all measurements reported a write latency below or equal 19 ms.
In performance engineering, percentiles are being used to analyse the long tail of measurement series. That is, using percentiles, one can better understand how latencies are distributed in a measurement series.
Data Sets
The data sets produced for as well as the scripts and configurations used for YCSB in this whitepaper are available at request. Please get in touch.
About benchANT
benchANT is a spin-off of the University of Ulm. benchANT develops and operates a benchmarking-as-a-service platform for cloud database benchmarking.
The unique software solution helps IT decision-makers, such as software architects and IT consultants, to make quantitative decisions based on meaningful measurement results. Through benchmarking, more suitable cloud resources and database configurations are detected, and more reliable decisions are made. This leads to a minimisation of risk during the software development cycle as well as an optimisation of efficiency with regard to the technologies, resources and costs used.
Cloud resources represent the most common IT infrastructure solution in the 2020s and databases are experiencing a renaissance due to the trend towards data-driven software applications in the areas of IoT, AI Big Data, but also Web 2.0 and eCommerce. There is a large, growing variety of competing database manufacturers and cloud providers on the market with millions of possible combinations. At the same time, there is a desire for a solution to find one's way through this multitude of offers and to make smart decisions.
The benchANT cloud database benchmarking platform provides a modern, simple and reliable solution for various use cases for individual requirements:
- Cloud and database resource selection
- Cost optimisation
- SLA, load & stress testing
- capacity planning
- Version monitoring
benchANT sees cloud database benchmarking as an essential discipline of performance engineering of the 2020s to improve IT alignment, reduce costs and increase quality in software development.
benchANT is funded by the EXIST research transfer grant from the BMWi and the European Social Fund and plans to spin out as an independent company. A functional alpha version is available since summer 2021, demonstrating the platform's functionality and potential.
Feel free to contact us if you are interested in cloud database benchmarking results or would like to learn more about our venture.